> ## Documentation Index
> Fetch the complete documentation index at: https://docs.vizkraft.com/llms.txt
> Use this file to discover all available pages before exploring further.
# Dashboards
> Organize charts into dashboards that your team can review, filter, and export.
Dashboards let you combine saved charts into a single view that can be monitored, filtered, exported, and shared with your team.
## What a dashboard includes
Each dashboard can include:
* Multiple saved charts
* A flexible layout with drag and resize controls
* Dashboard-level filters
* Saved views
* Export options
* Suggested dashboards that can be kept or dismissed
## Where dashboards fit in the workflow
The usual path is:
1. Ask a question in chat.
2. Save the charts you want to keep.
3. Create a dashboard.
4. Add saved charts and arrange them.
5. Apply filters or save views for repeat use.
## What you can do from the dashboards page
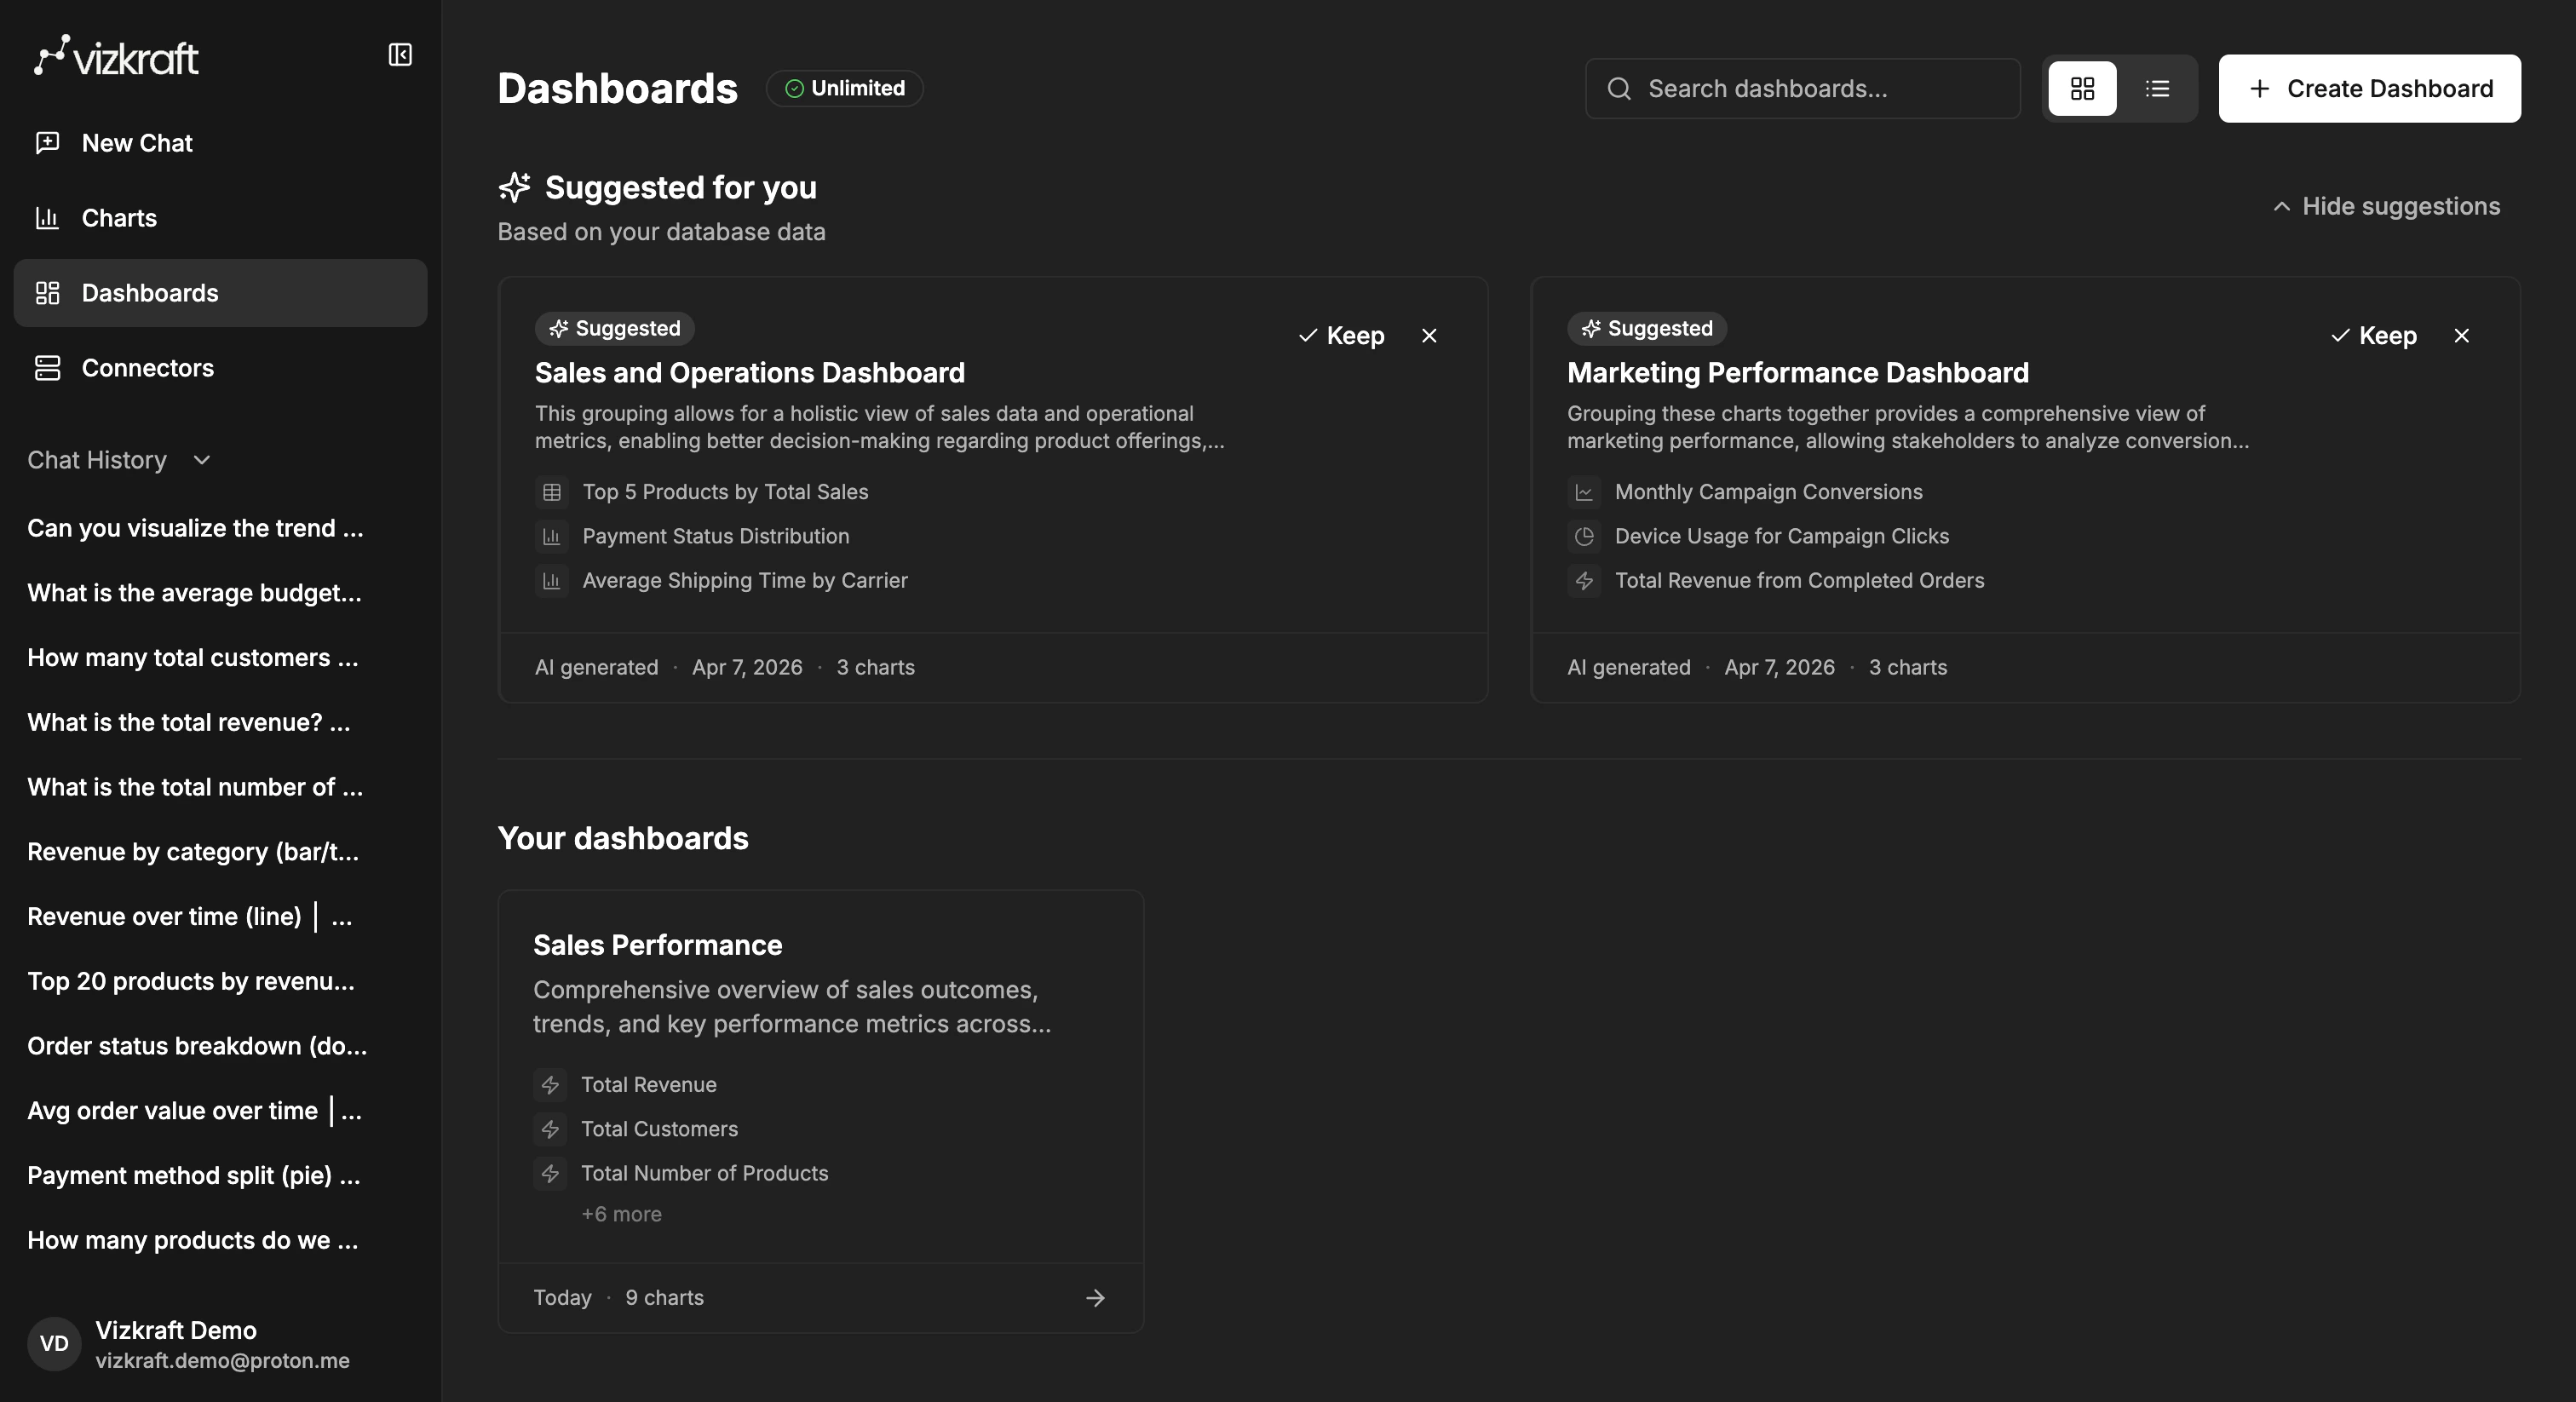
The dashboards library is where you:
* Create a new dashboard.
* Search existing dashboards.
* Switch between card and list views.
* Open, edit, or delete dashboards.
* Review suggested dashboards separately from your saved dashboards.
 ## What you can do inside a dashboard
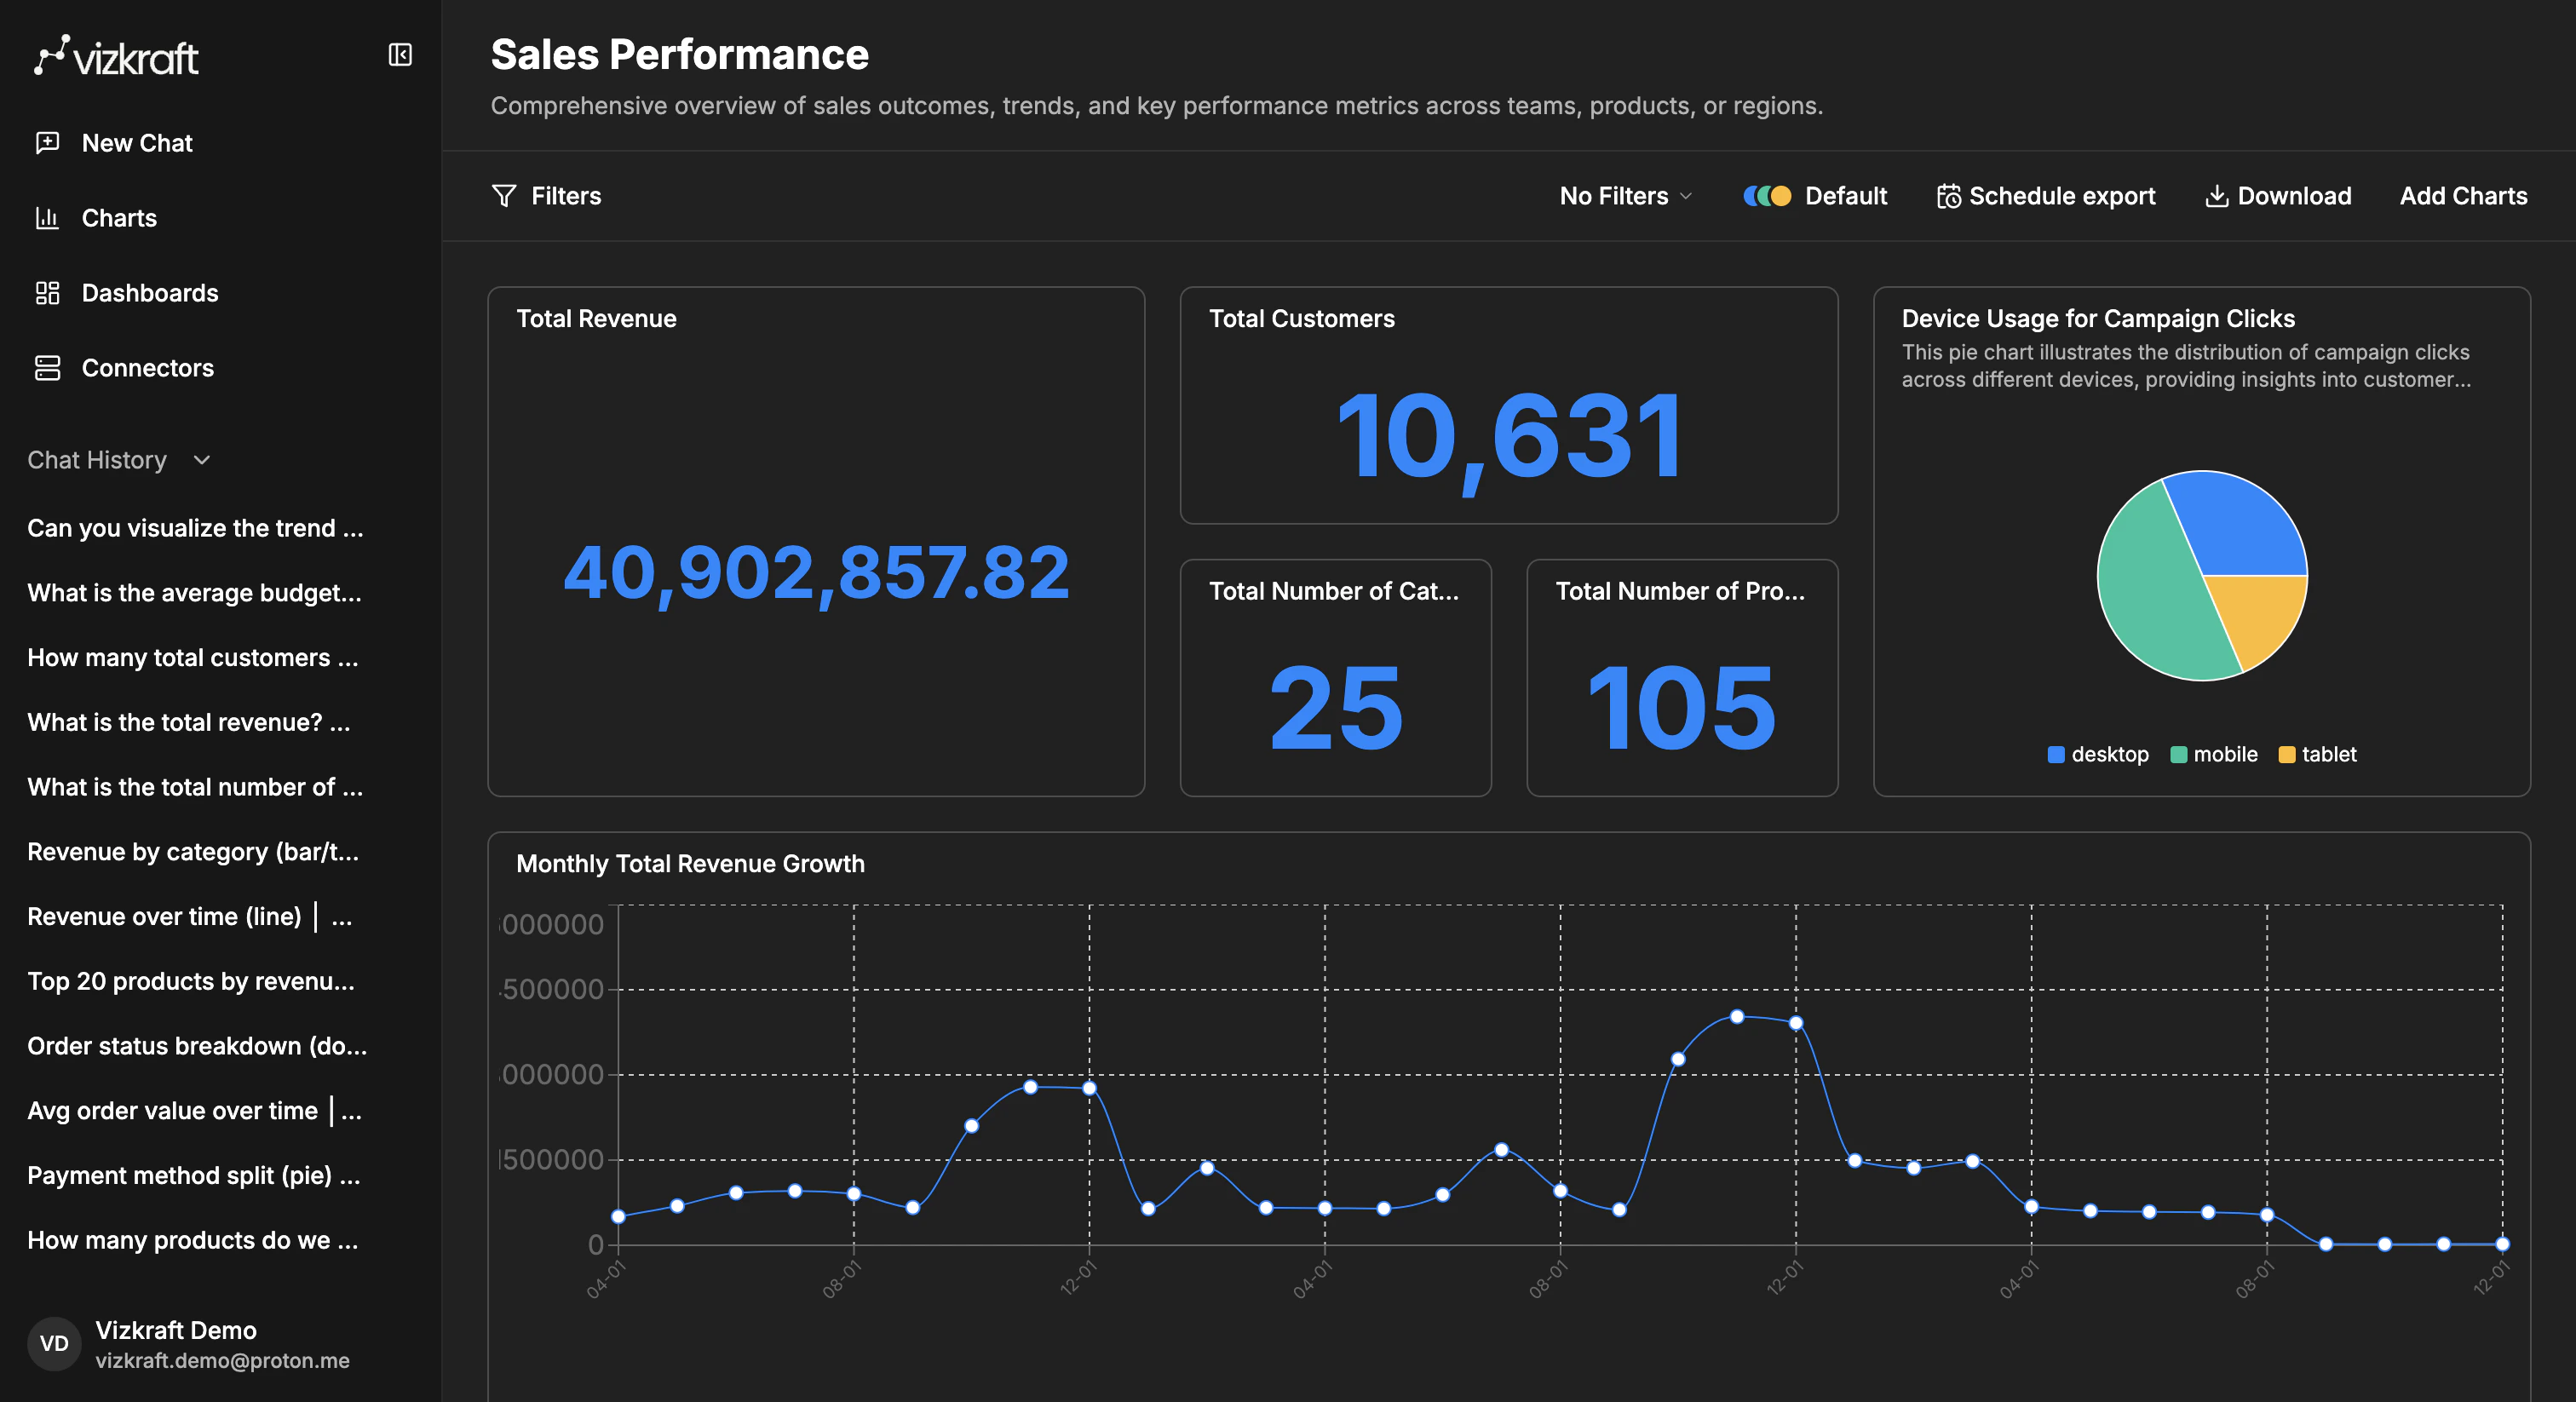
Once a dashboard is open, you can:
* Drag charts into a better layout.
* Resize charts to give important visuals more space.
* Remove a chart without deleting it from your chart library.
* Open a larger chart view when you need more detail.
* Refresh charts backed by live data.
* Toggle table view for charts that are easier to inspect as rows.
## What you can do inside a dashboard
Once a dashboard is open, you can:
* Drag charts into a better layout.
* Resize charts to give important visuals more space.
* Remove a chart without deleting it from your chart library.
* Open a larger chart view when you need more detail.
* Refresh charts backed by live data.
* Toggle table view for charts that are easier to inspect as rows.
 ## Views, filters, and exports
Dashboards support more than layout alone. You can also:
* Apply dashboard-level filters.
* Save filtered dashboard views.
* Schedule exports.
* Download the dashboard as PNG or PDF.
## Suggested dashboards
Suggested dashboards appear in the dashboards library when Vizkraft has analyzed your connector and prepared recommendations for you.
From there you can:
* Keep the dashboard and add it to your collection.
* Dismiss the suggestion if it is not useful.
Keeping a suggested dashboard can also bring over the related suggested charts that belong to it.
## Best practices
* Keep one clear business question per dashboard.
* Use chart titles that make sense without extra explanation.
* Save views for recurring stakeholder questions.
* Use filters for audience-specific versions instead of duplicating the whole dashboard.
## Continue with the step-by-step guide
To build one from scratch, go to [Create dashboards](/guides/create-dashboards).
## Views, filters, and exports
Dashboards support more than layout alone. You can also:
* Apply dashboard-level filters.
* Save filtered dashboard views.
* Schedule exports.
* Download the dashboard as PNG or PDF.
## Suggested dashboards
Suggested dashboards appear in the dashboards library when Vizkraft has analyzed your connector and prepared recommendations for you.
From there you can:
* Keep the dashboard and add it to your collection.
* Dismiss the suggestion if it is not useful.
Keeping a suggested dashboard can also bring over the related suggested charts that belong to it.
## Best practices
* Keep one clear business question per dashboard.
* Use chart titles that make sense without extra explanation.
* Save views for recurring stakeholder questions.
* Use filters for audience-specific versions instead of duplicating the whole dashboard.
## Continue with the step-by-step guide
To build one from scratch, go to [Create dashboards](/guides/create-dashboards).