> ## Documentation Index
> Fetch the complete documentation index at: https://docs.vizkraft.com/llms.txt
> Use this file to discover all available pages before exploring further.
# Suggested charts and dashboards
> Review AI-prepared suggestions that appear after Vizkraft has analyzed your connected data.
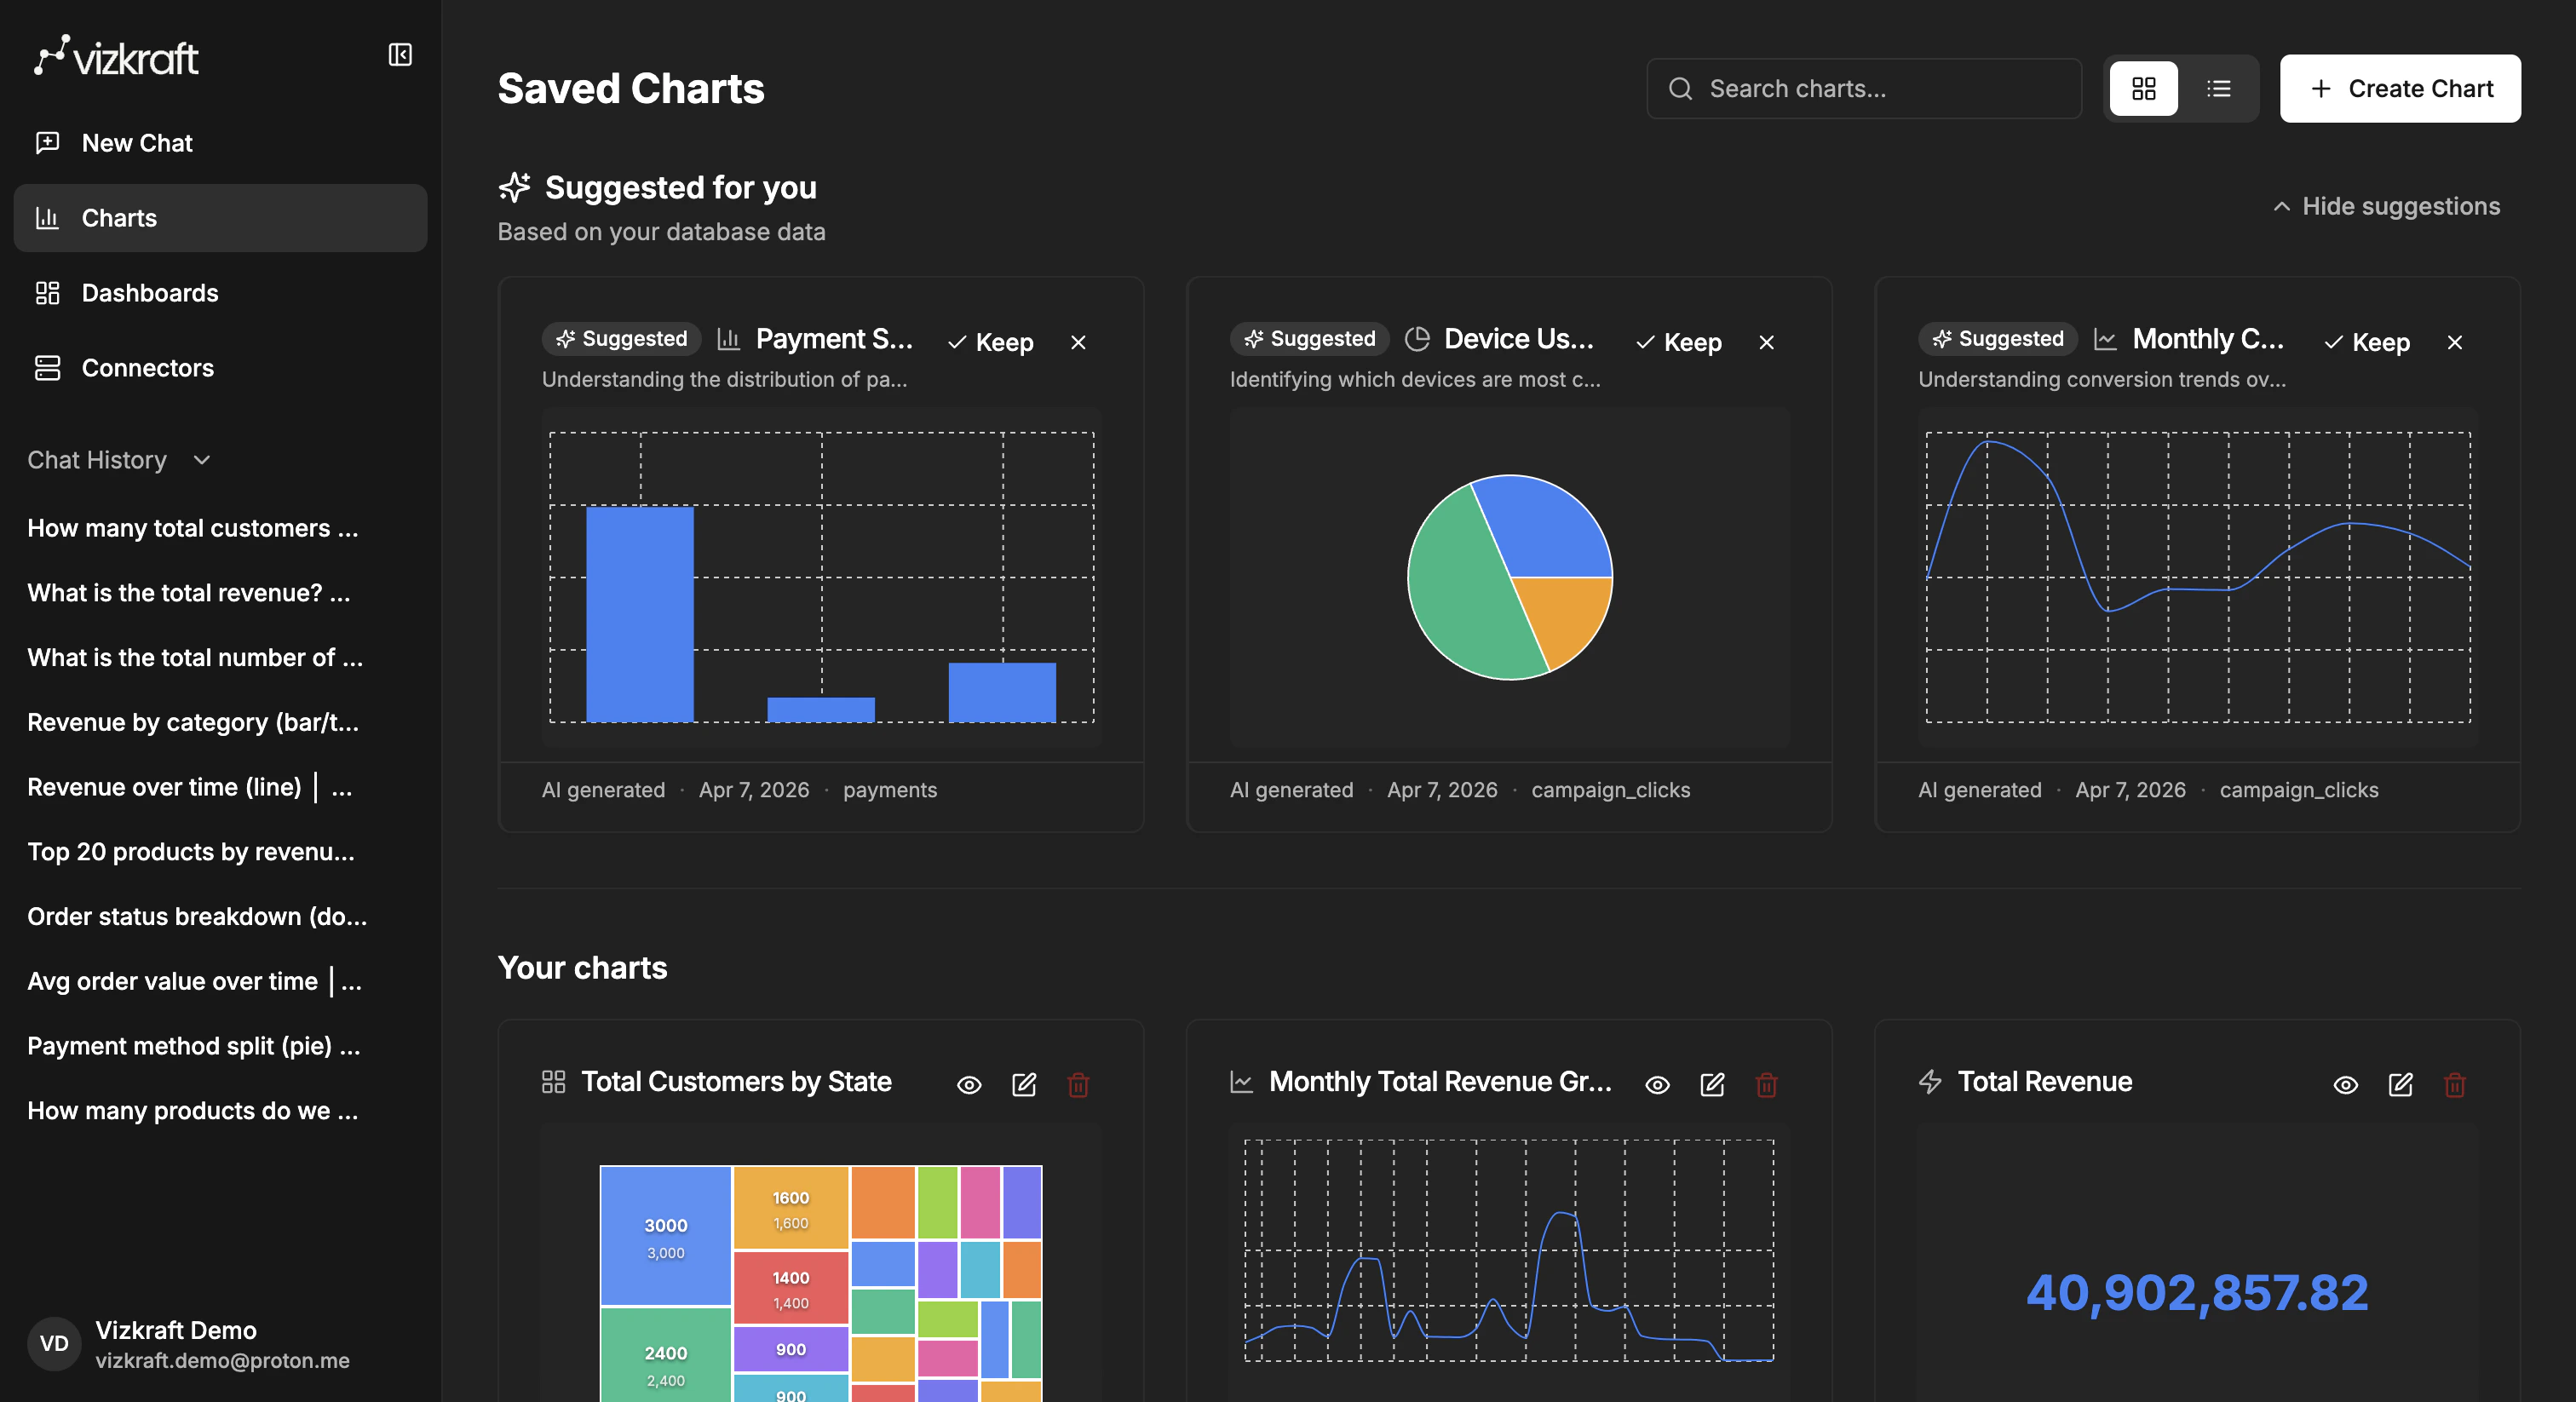
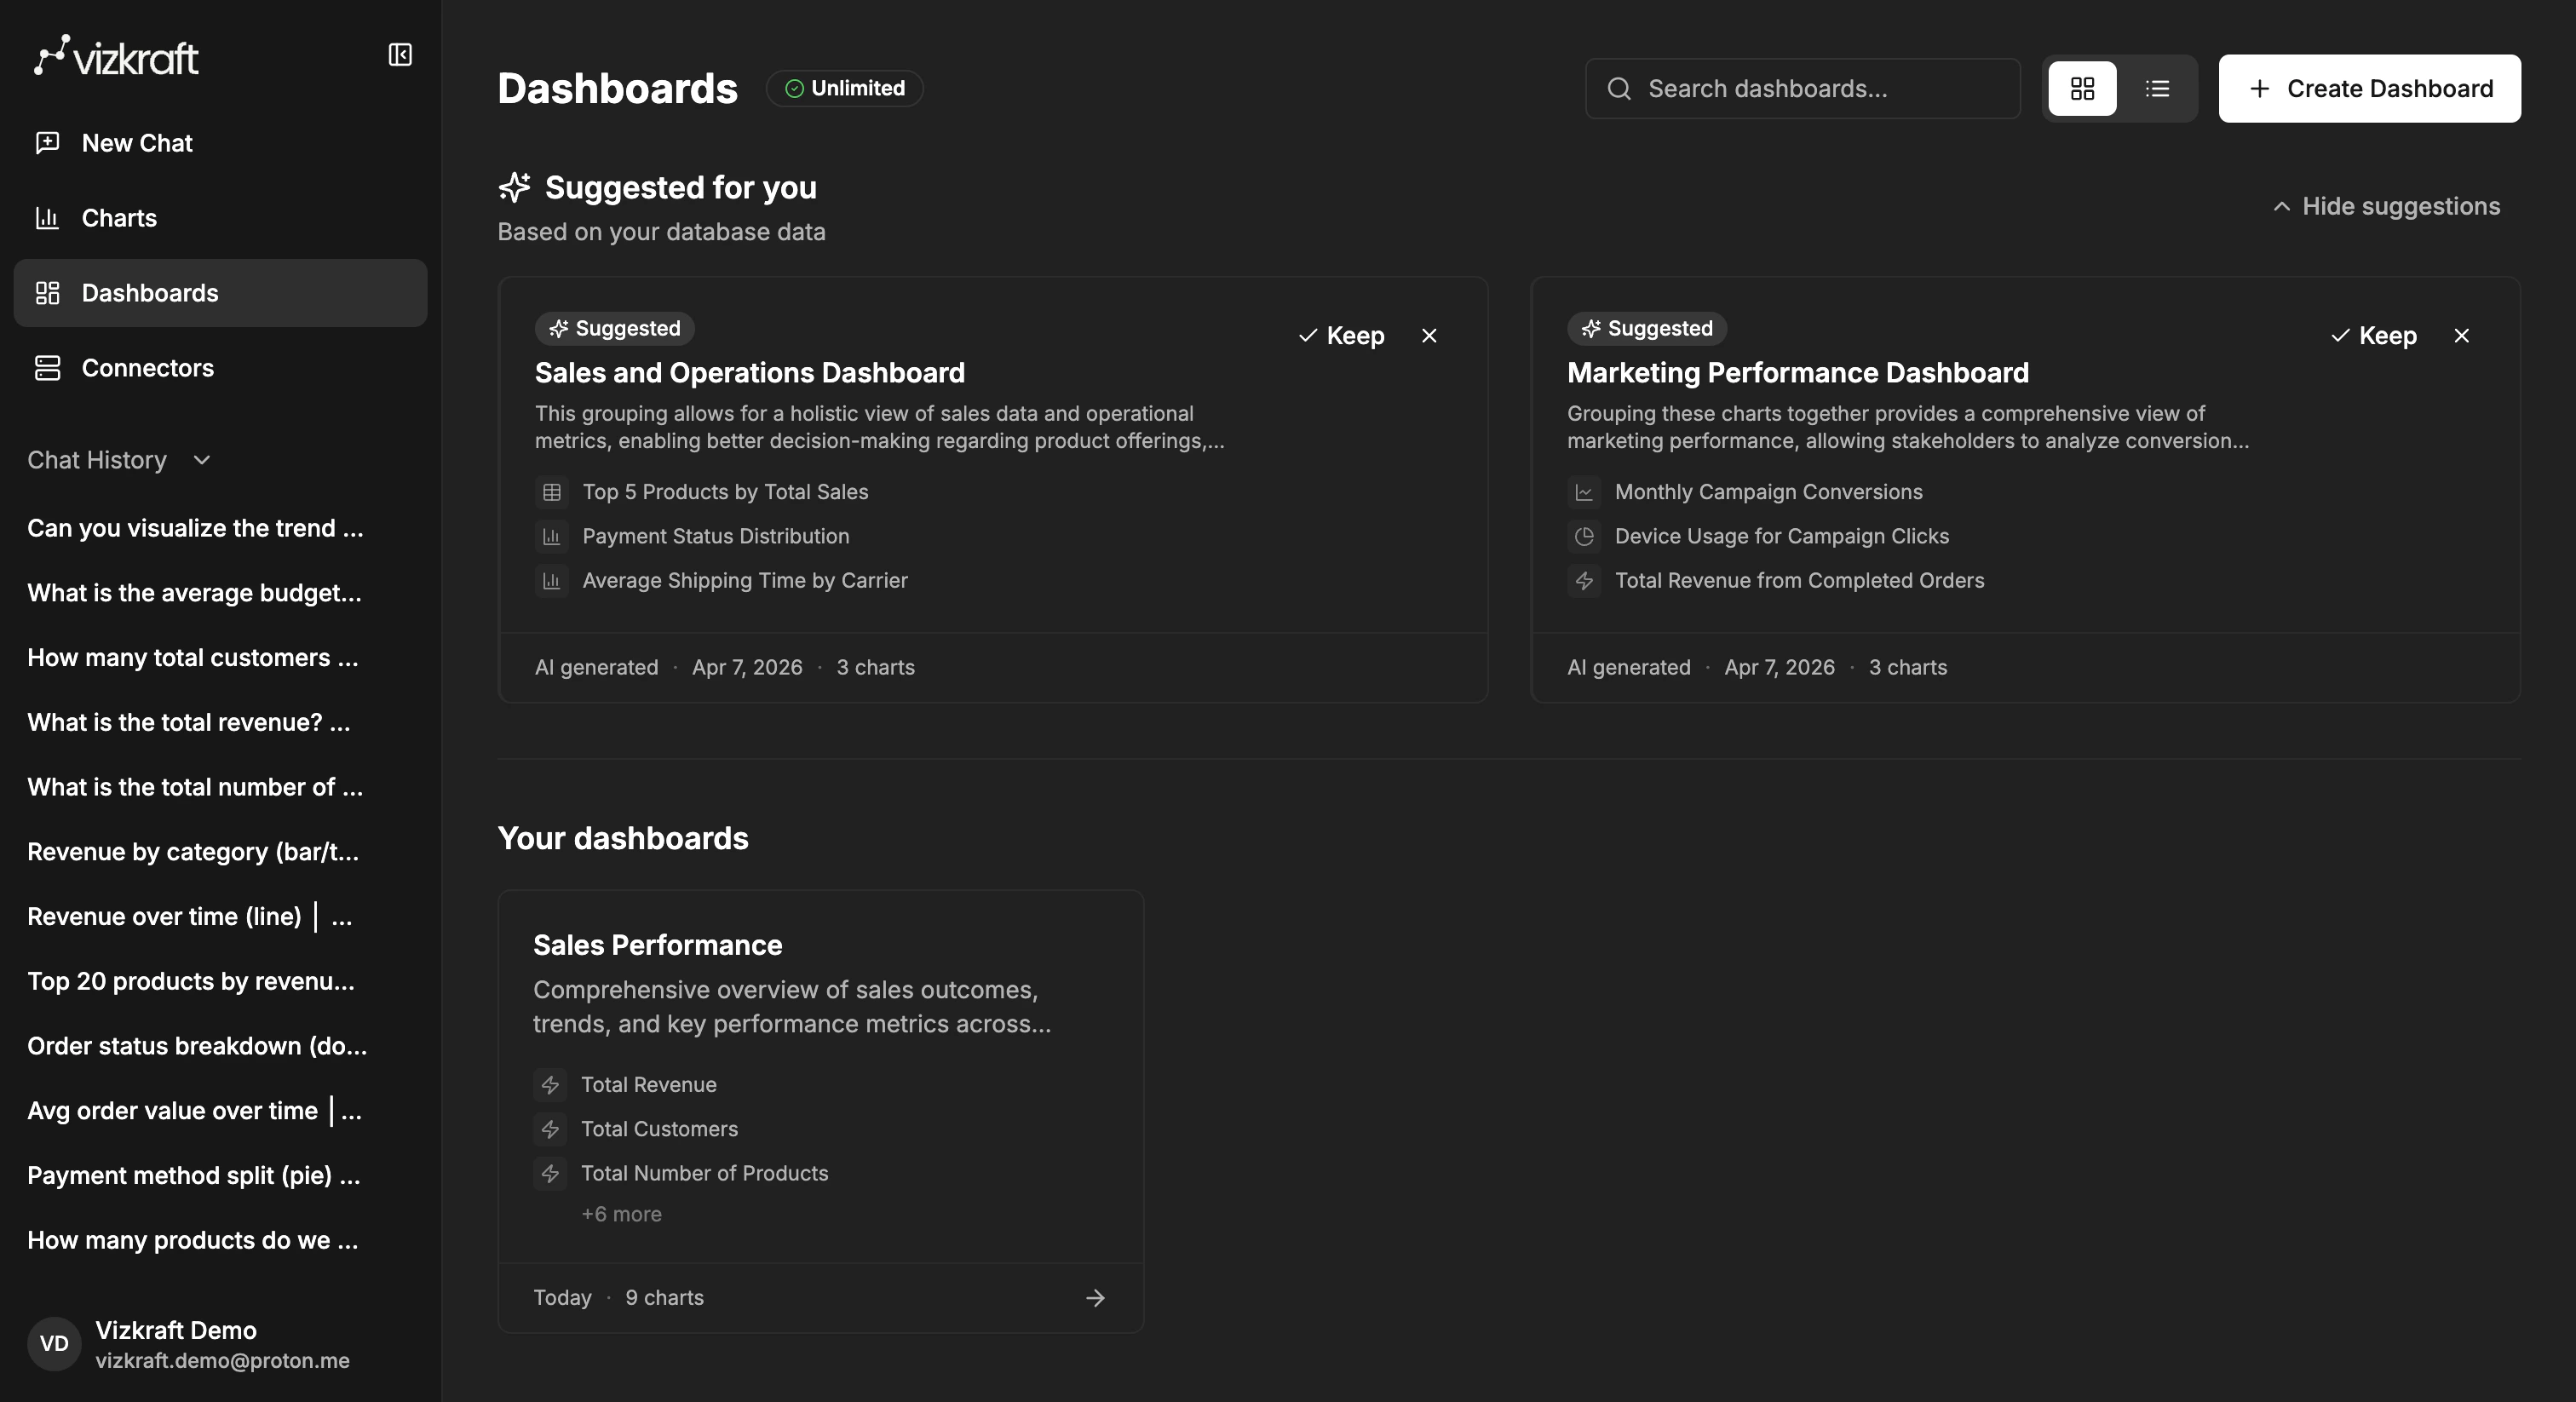
Vizkraft can prepare chart and dashboard suggestions for you after a connector has been connected and analyzed.
## Where suggestions appear
| Suggestion type | Where to find it |
| -------------------- | ----------------- |
| Suggested charts | `Charts` page |
| Suggested dashboards | `Dashboards` page |
Both areas keep suggested content separate from the charts and dashboards you have already saved.
 ## What happens before suggestions show up
Suggestions usually follow this flow:
1. Add a connector.
2. Run [indexing](/guides/index-your-data) for the connector (or catalog sync for HubSpot).
3. Select **important tables** if your schema is large — this steers which metrics Vizkraft prioritizes.
4. Wait while Vizkraft analyzes the source and prepares suggestions.
5. Refresh `Charts` or `Dashboards` if needed.
While suggestions are being generated, the library pages show a loading state instead of an empty list. Give the job time to finish before assuming nothing was created.
## Keep or dismiss
For both suggested charts and suggested dashboards, you can:
* **Keep** the suggestion and add it to your collection.
* **Dismiss** the suggestion if it is not useful.
When you keep a suggested dashboard, Vizkraft also keeps the related charts that belong to that dashboard. You do not need to accept each chart individually.
## How to use suggestions well
Suggestions are best used as:
* A starting point for a new dashboard.
* A shortcut for common business questions.
* A way to discover useful tables or metrics after a fresh connector is indexed.
They are not final by default. You can still [edit charts](/guides/edit-charts), add [filters](/guides/filters-views-and-exports), save views, or reorganize dashboard layouts after keeping them.
## If suggestions are not visible yet
Check the following:
* The connector was saved successfully.
* Indexing or catalog sync is complete for the connector.
* Important tables were selected if your schema is large.
* Enough time has passed for Vizkraft to generate suggestions (watch for the generating state on the library page).
* You refreshed the `Charts` or `Dashboards` page after indexing.
## Stale suggestions after re-index
If you re-indexed a connector and suggestions look outdated:
1. Dismiss suggestions that no longer match your schema.
2. Wait for Vizkraft to generate a fresh batch after re-indexing completes.
3. Refresh the library page.
Re-indexing does not automatically remove old suggestions you already kept — only pending suggestions are replaced.
## Next step
If you want to tune the generated content, continue with [Edit charts](/guides/edit-charts) or [Create dashboards](/guides/create-dashboards).
## What happens before suggestions show up
Suggestions usually follow this flow:
1. Add a connector.
2. Run [indexing](/guides/index-your-data) for the connector (or catalog sync for HubSpot).
3. Select **important tables** if your schema is large — this steers which metrics Vizkraft prioritizes.
4. Wait while Vizkraft analyzes the source and prepares suggestions.
5. Refresh `Charts` or `Dashboards` if needed.
While suggestions are being generated, the library pages show a loading state instead of an empty list. Give the job time to finish before assuming nothing was created.
## Keep or dismiss
For both suggested charts and suggested dashboards, you can:
* **Keep** the suggestion and add it to your collection.
* **Dismiss** the suggestion if it is not useful.
When you keep a suggested dashboard, Vizkraft also keeps the related charts that belong to that dashboard. You do not need to accept each chart individually.
## How to use suggestions well
Suggestions are best used as:
* A starting point for a new dashboard.
* A shortcut for common business questions.
* A way to discover useful tables or metrics after a fresh connector is indexed.
They are not final by default. You can still [edit charts](/guides/edit-charts), add [filters](/guides/filters-views-and-exports), save views, or reorganize dashboard layouts after keeping them.
## If suggestions are not visible yet
Check the following:
* The connector was saved successfully.
* Indexing or catalog sync is complete for the connector.
* Important tables were selected if your schema is large.
* Enough time has passed for Vizkraft to generate suggestions (watch for the generating state on the library page).
* You refreshed the `Charts` or `Dashboards` page after indexing.
## Stale suggestions after re-index
If you re-indexed a connector and suggestions look outdated:
1. Dismiss suggestions that no longer match your schema.
2. Wait for Vizkraft to generate a fresh batch after re-indexing completes.
3. Refresh the library page.
Re-indexing does not automatically remove old suggestions you already kept — only pending suggestions are replaced.
## Next step
If you want to tune the generated content, continue with [Edit charts](/guides/edit-charts) or [Create dashboards](/guides/create-dashboards).