> ## Documentation Index
> Fetch the complete documentation index at: https://docs.vizkraft.com/llms.txt
> Use this file to discover all available pages before exploring further.
# Filters, views, and exports
> Make dashboards reusable by applying filters, saving views, and exporting what matters.
Once a dashboard is built, filters and saved views make it much easier to reuse the same dashboard for different audiences or questions.
## Dashboard filters
Dashboard filters let you narrow the data shown across the charts in a dashboard.
You can use filters to:
* Focus on a region, team, customer segment, or product line.
* Limit the dashboard to a specific time period.
* Create stakeholder-specific slices without building a brand new dashboard.
## How filters work
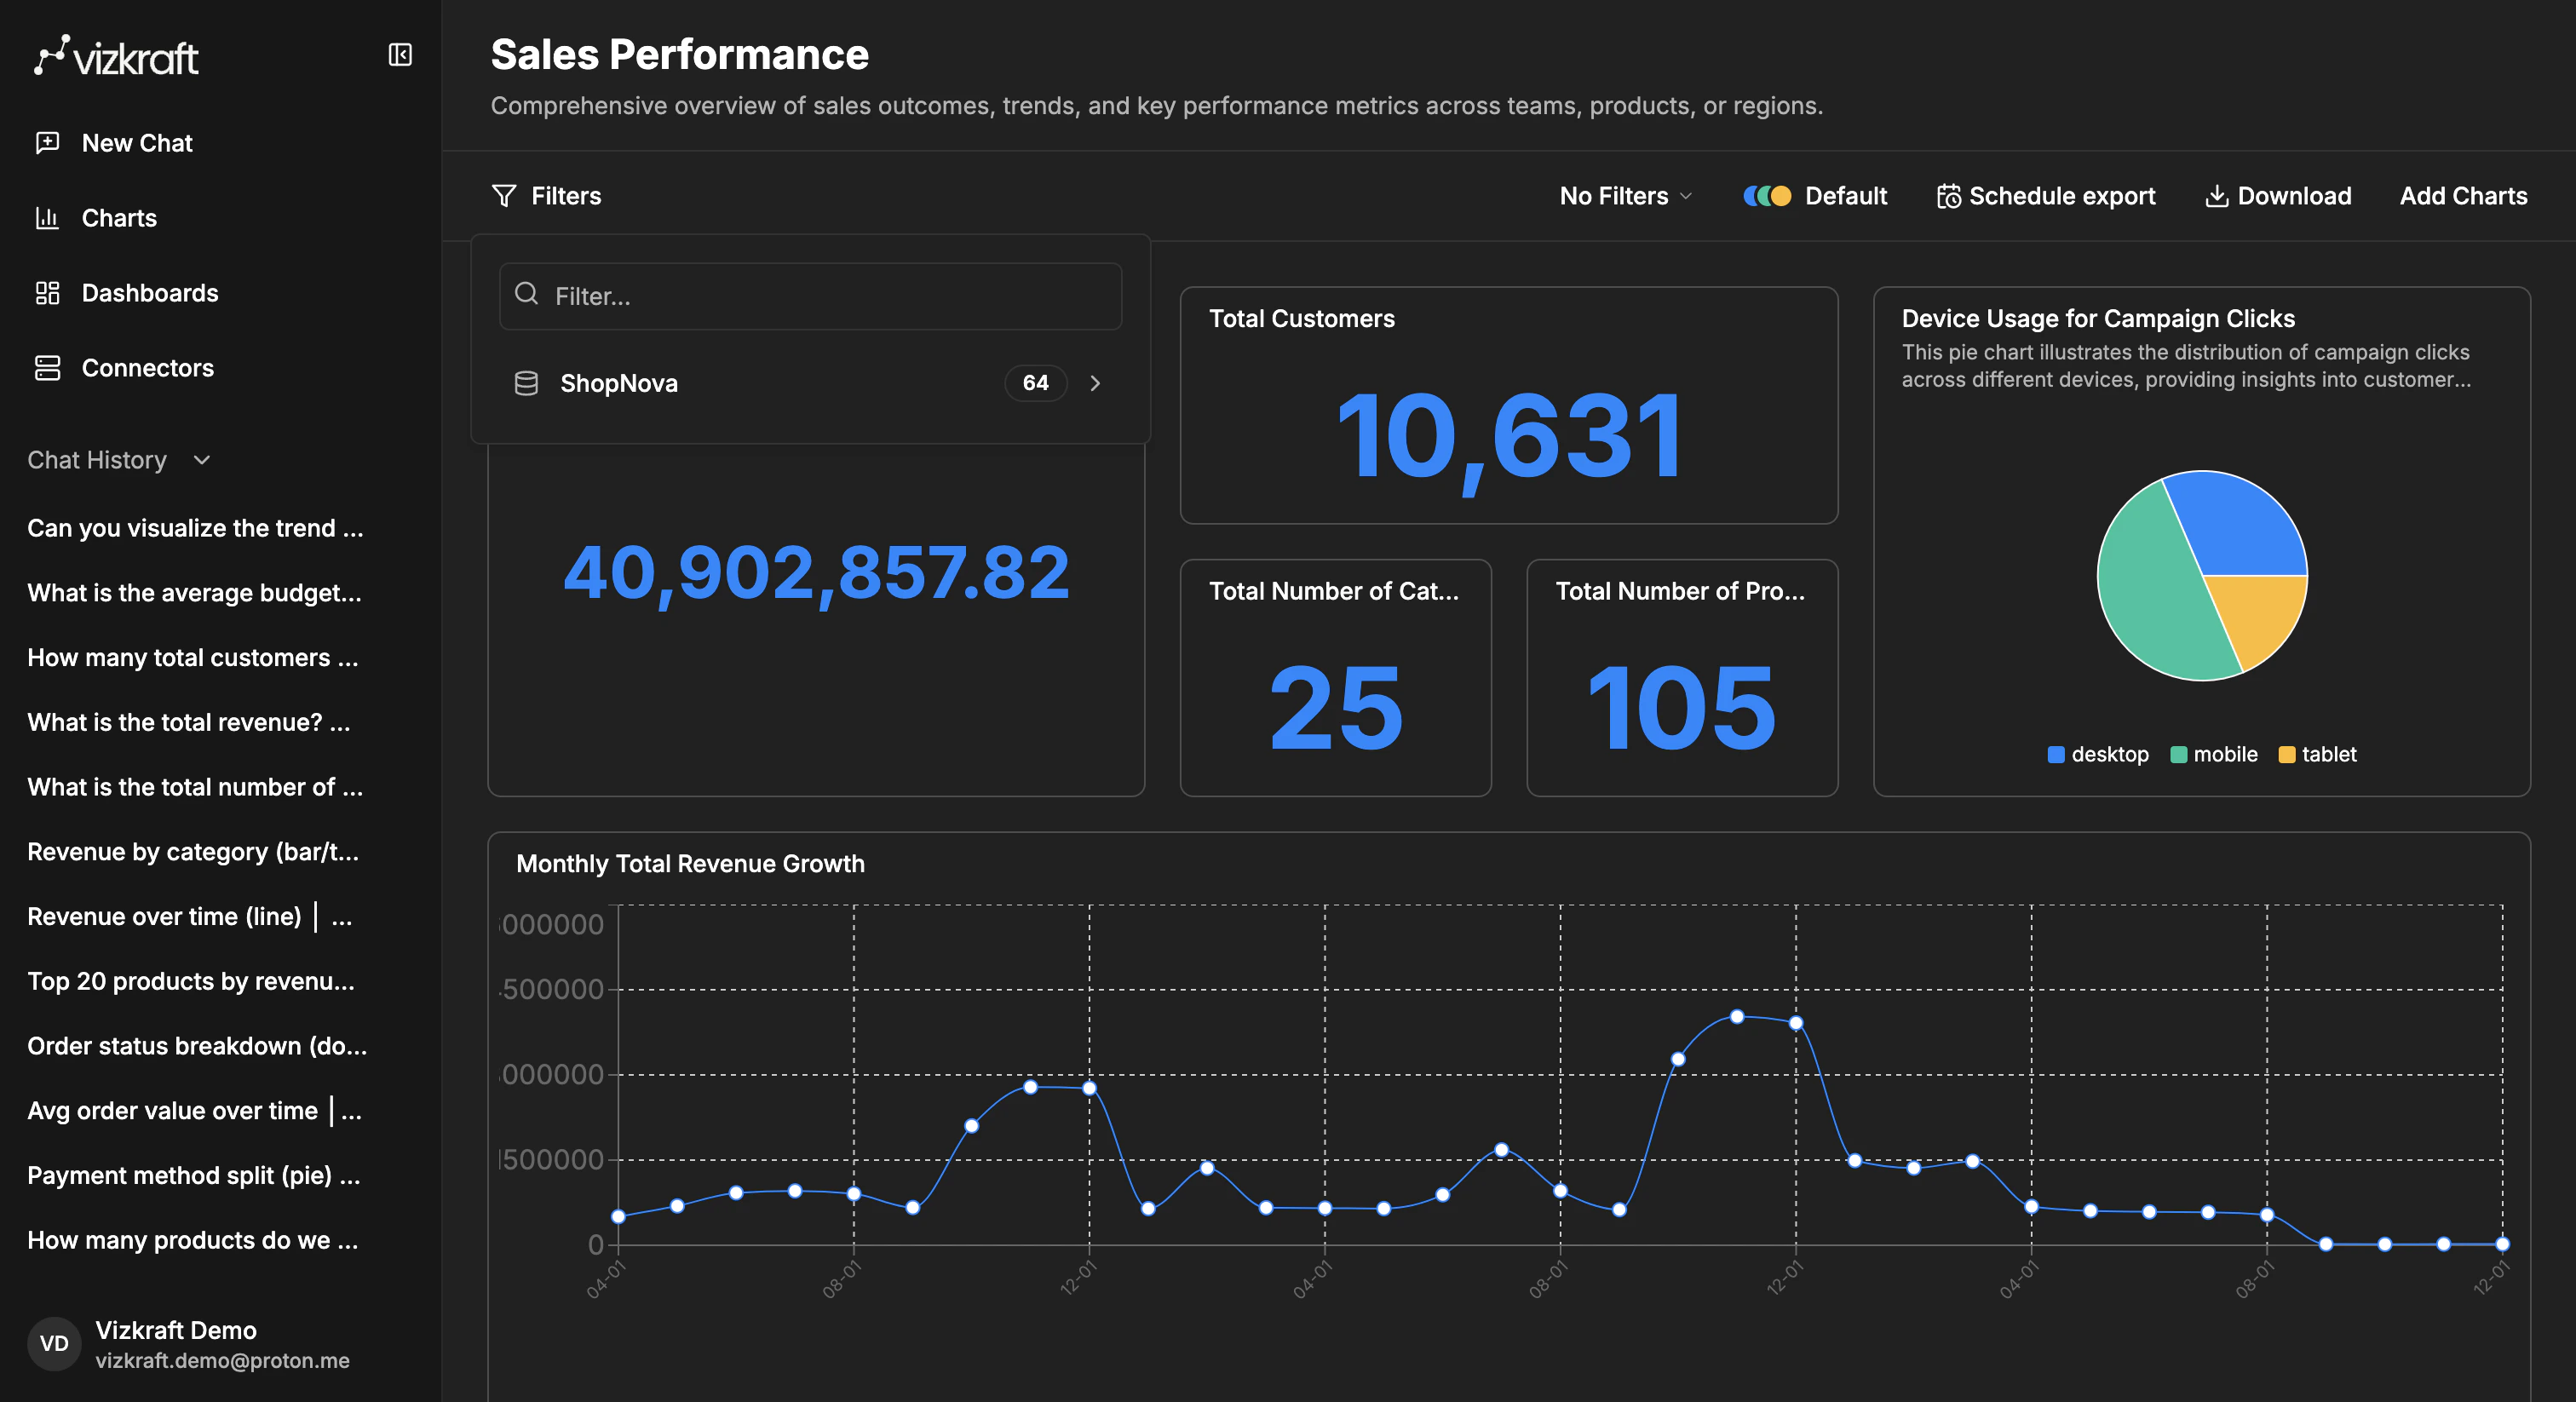
Filters are added from the dashboard itself. Vizkraft groups available filter columns by connector so you can tell where each filter comes from.
As filters are applied, charts that are affected can reflect the updated slice of data.
 ## AI filters
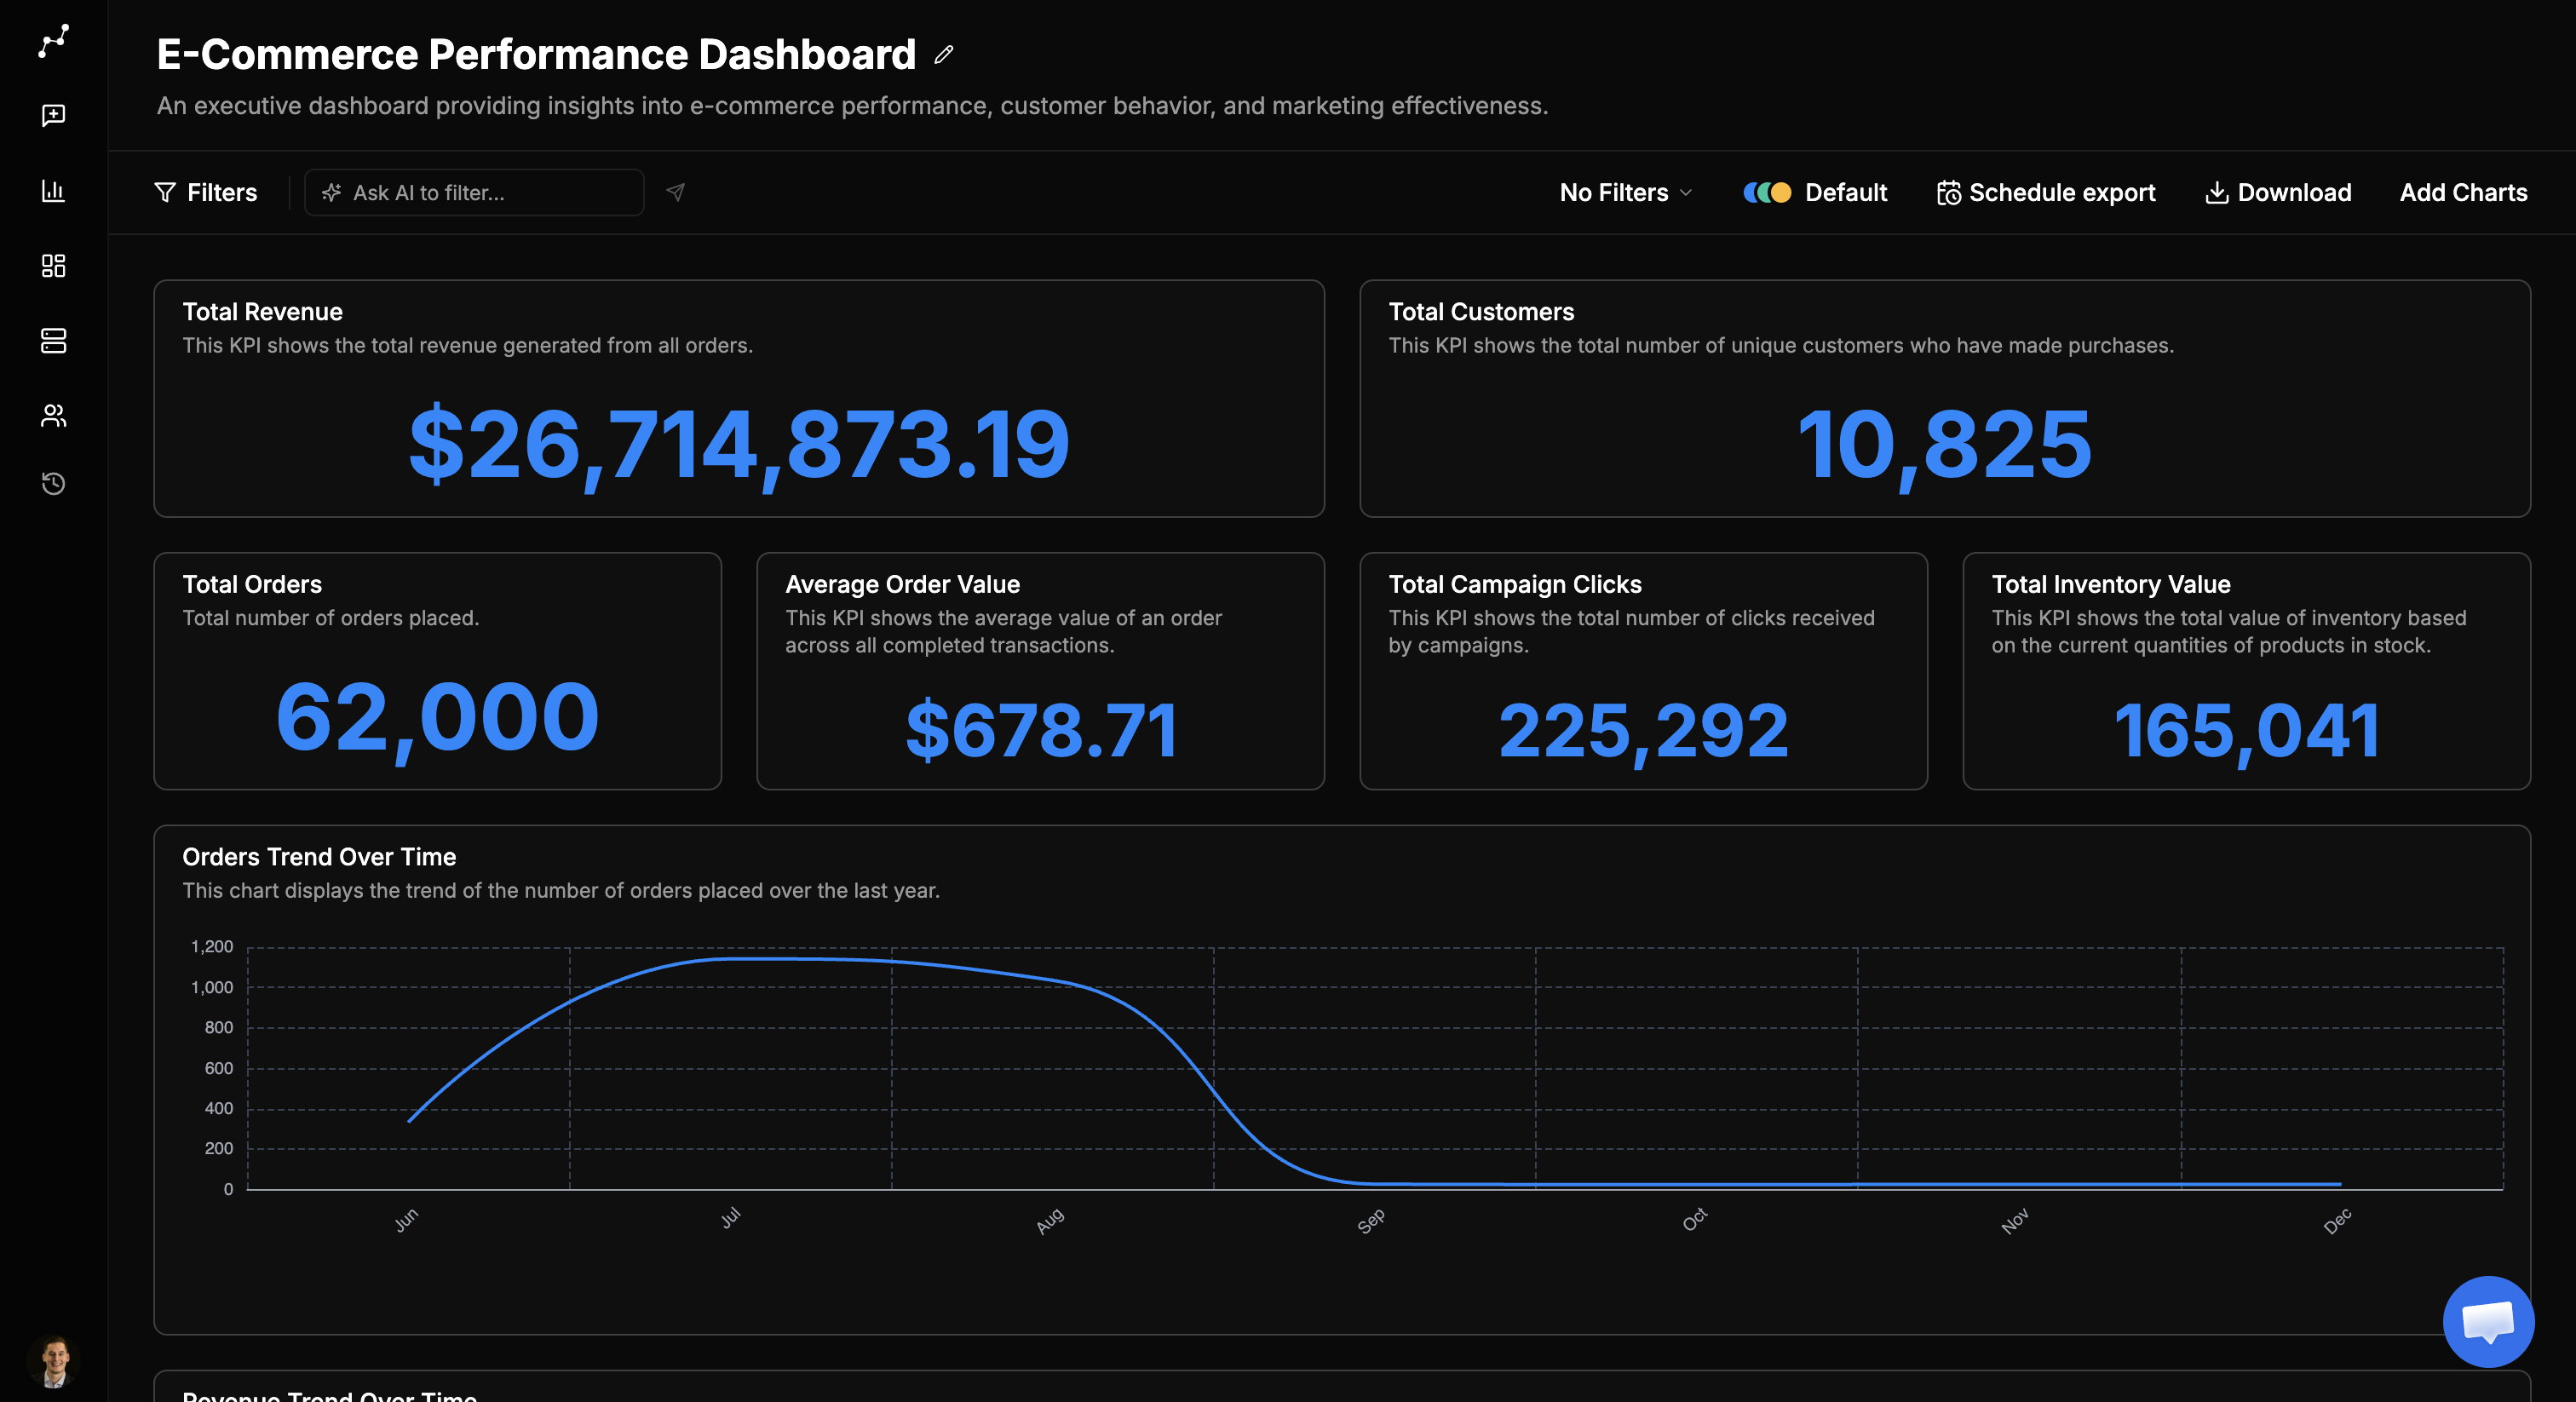
Instead of picking columns manually, type what you want in plain language using the AI filter input at the top of the dashboard.
## AI filters
Instead of picking columns manually, type what you want in plain language using the AI filter input at the top of the dashboard.
 Examples:
* Last 90 days only
* Region equals North America
* Show enterprise customers with revenue above 100k
Vizkraft parses your request into dashboard filters and shows a short explanation of what was applied. You can:
* Submit a new filter query to refine the slice.
* Open **History** to re-apply a previous AI filter.
* Clear AI filters to return to manual filter controls.
AI filters work alongside manual filters. If you already applied manual filters, Vizkraft takes them into account when parsing your next query.
## Smart filters
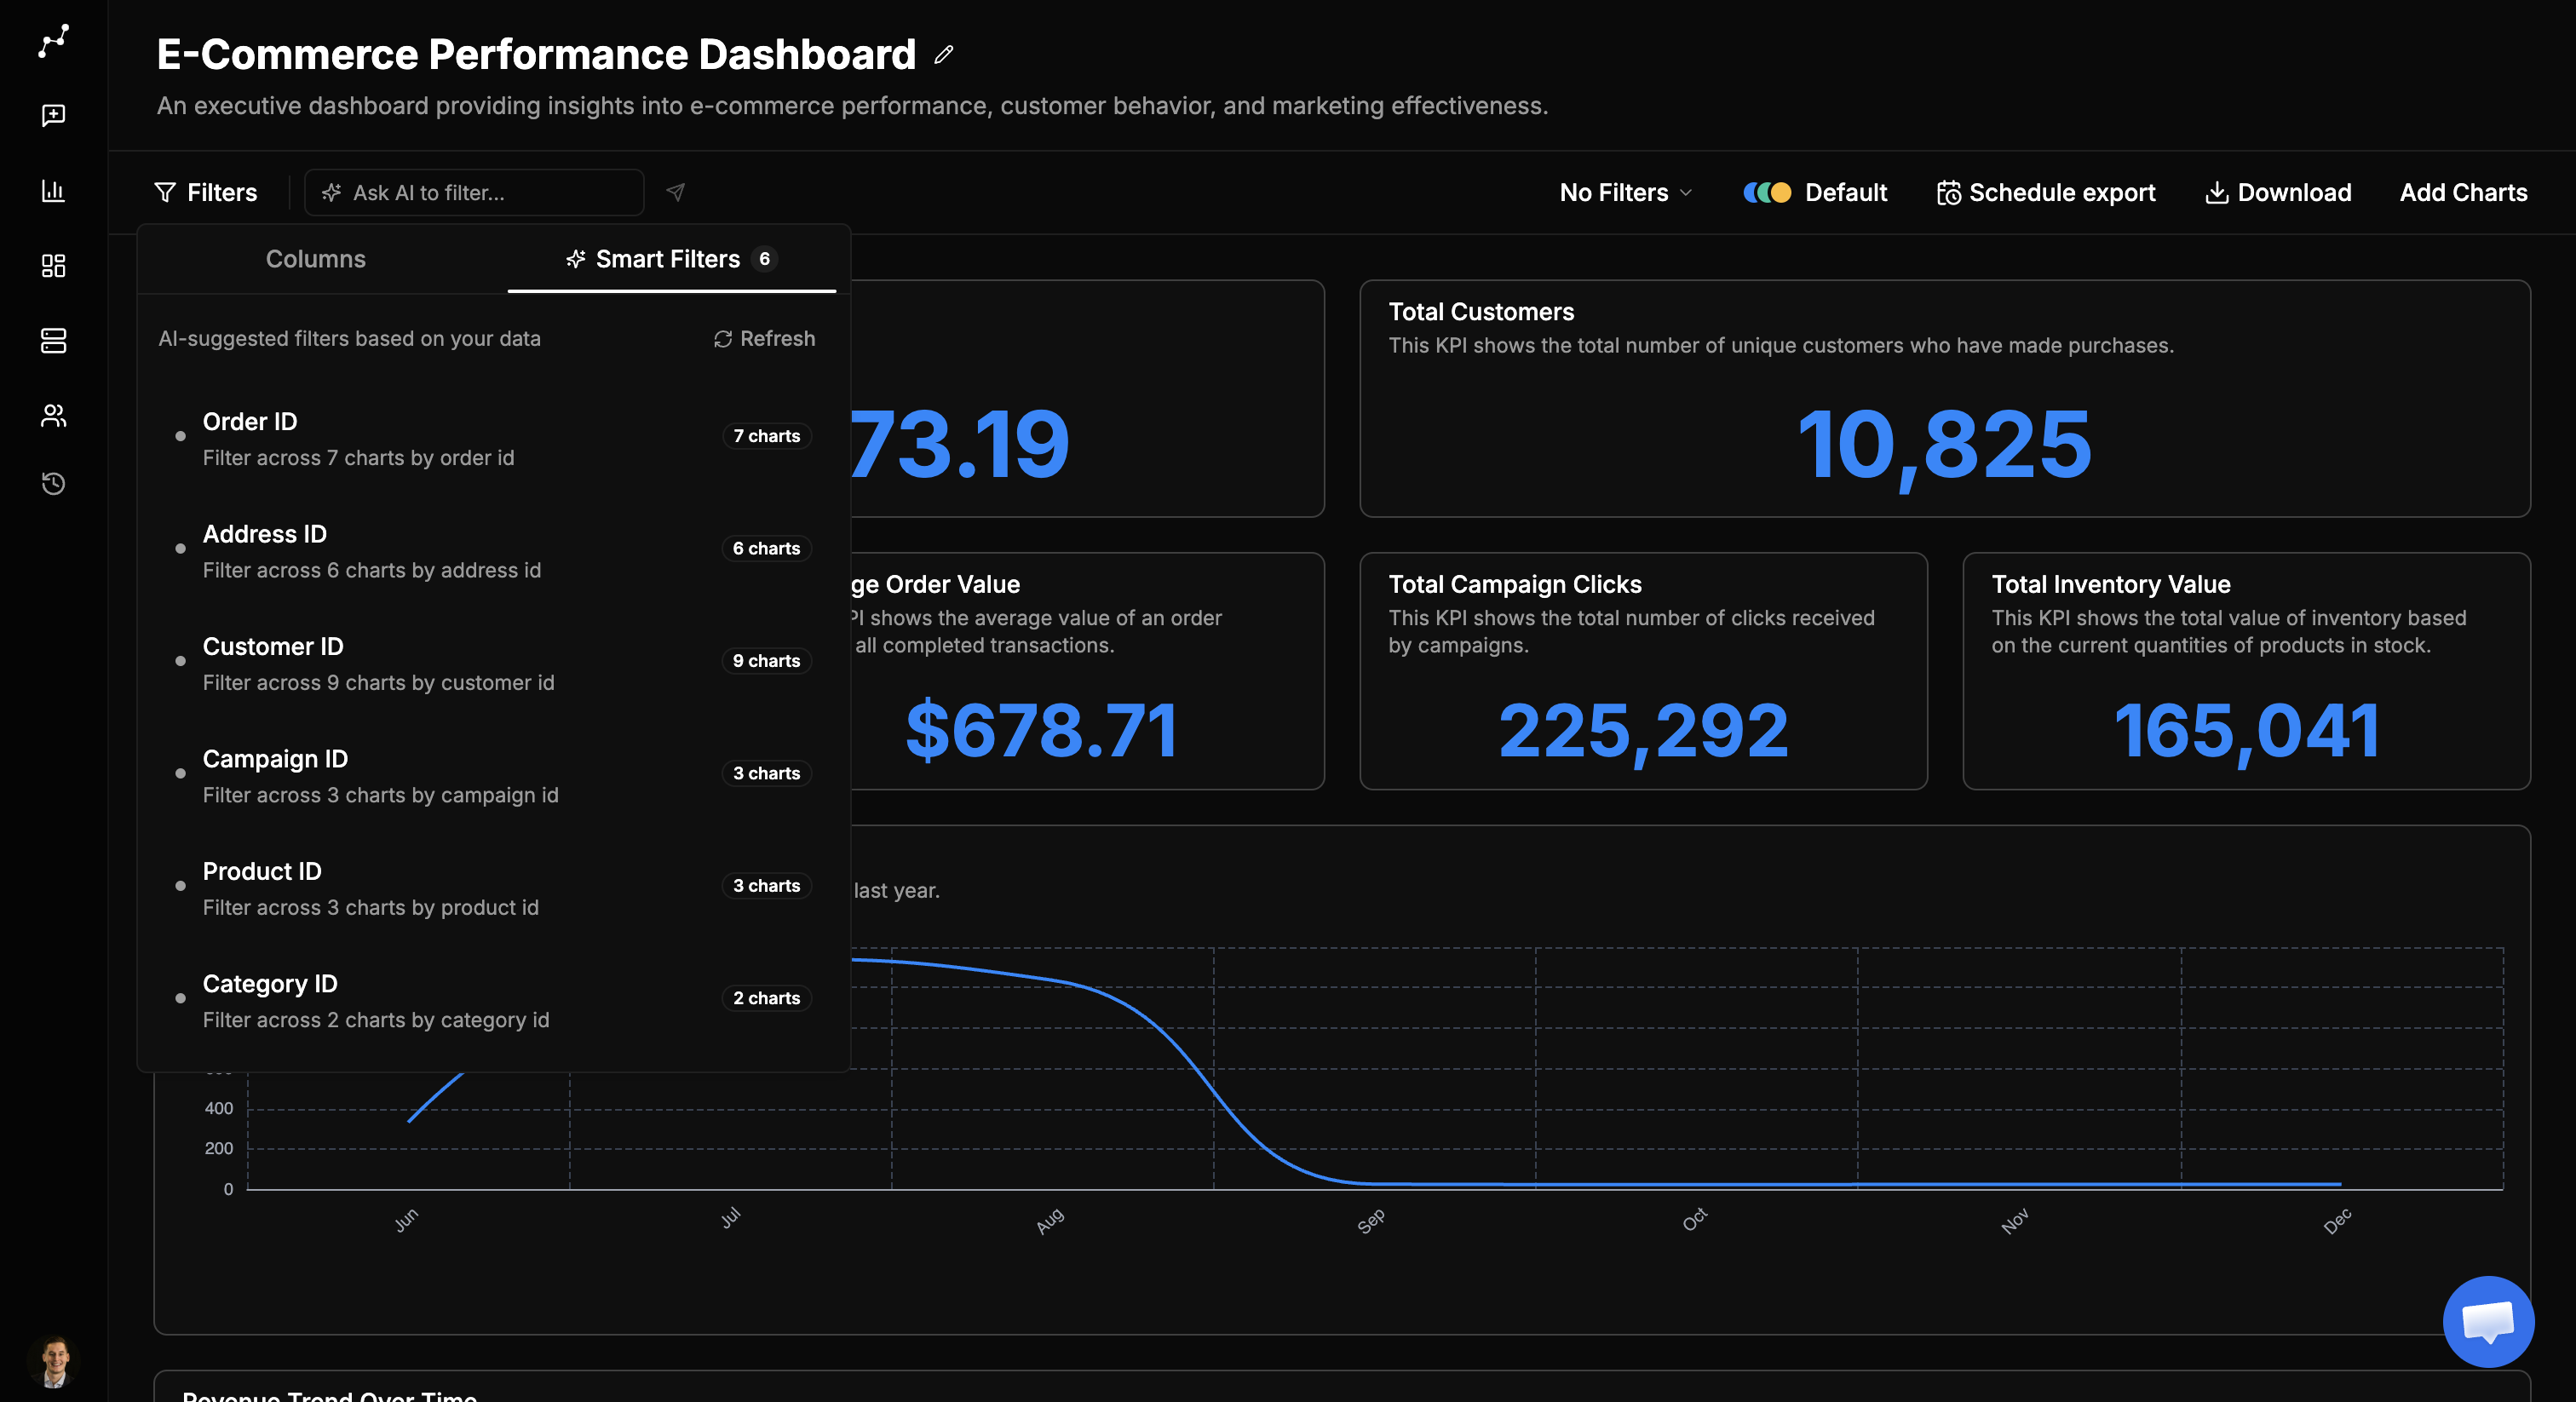
Smart filters are AI-suggested filter shortcuts based on your dashboard's charts and data.
Examples:
* Last 90 days only
* Region equals North America
* Show enterprise customers with revenue above 100k
Vizkraft parses your request into dashboard filters and shows a short explanation of what was applied. You can:
* Submit a new filter query to refine the slice.
* Open **History** to re-apply a previous AI filter.
* Clear AI filters to return to manual filter controls.
AI filters work alongside manual filters. If you already applied manual filters, Vizkraft takes them into account when parsing your next query.
## Smart filters
Smart filters are AI-suggested filter shortcuts based on your dashboard's charts and data.
 From the filter panel:
1. Open the **Smart filters** section.
2. Review suggested filter badges (for example, a high-value segment or recent time window).
3. Click a badge to configure and apply it.
4. Use **Regenerate smart filters** if your dashboard layout changed or you added new charts.
Smart filters that are already applied are hidden from the suggestion list so you do not duplicate them.
## Save a dashboard view
Use saved views when the same dashboard needs multiple versions.
Saving a view preserves the filter state so you can return to it later without rebuilding the setup by hand.
### Example: campaign performance dashboard
Imagine you have a `Campaign performance` dashboard and you add `campaign name` as a dashboard filter.
You could then create saved views like:
* `Spring sale 2025`
* `Holiday retargeting`
* `Black Friday launch`
* `Summer clearance`
* `Always-on brand campaigns`
Each saved view keeps the selected filter state for that campaign. That means a user can open the dashboard later, choose the saved view they want, and immediately see the dashboard with the right campaign filter already applied.
## Schedule exports
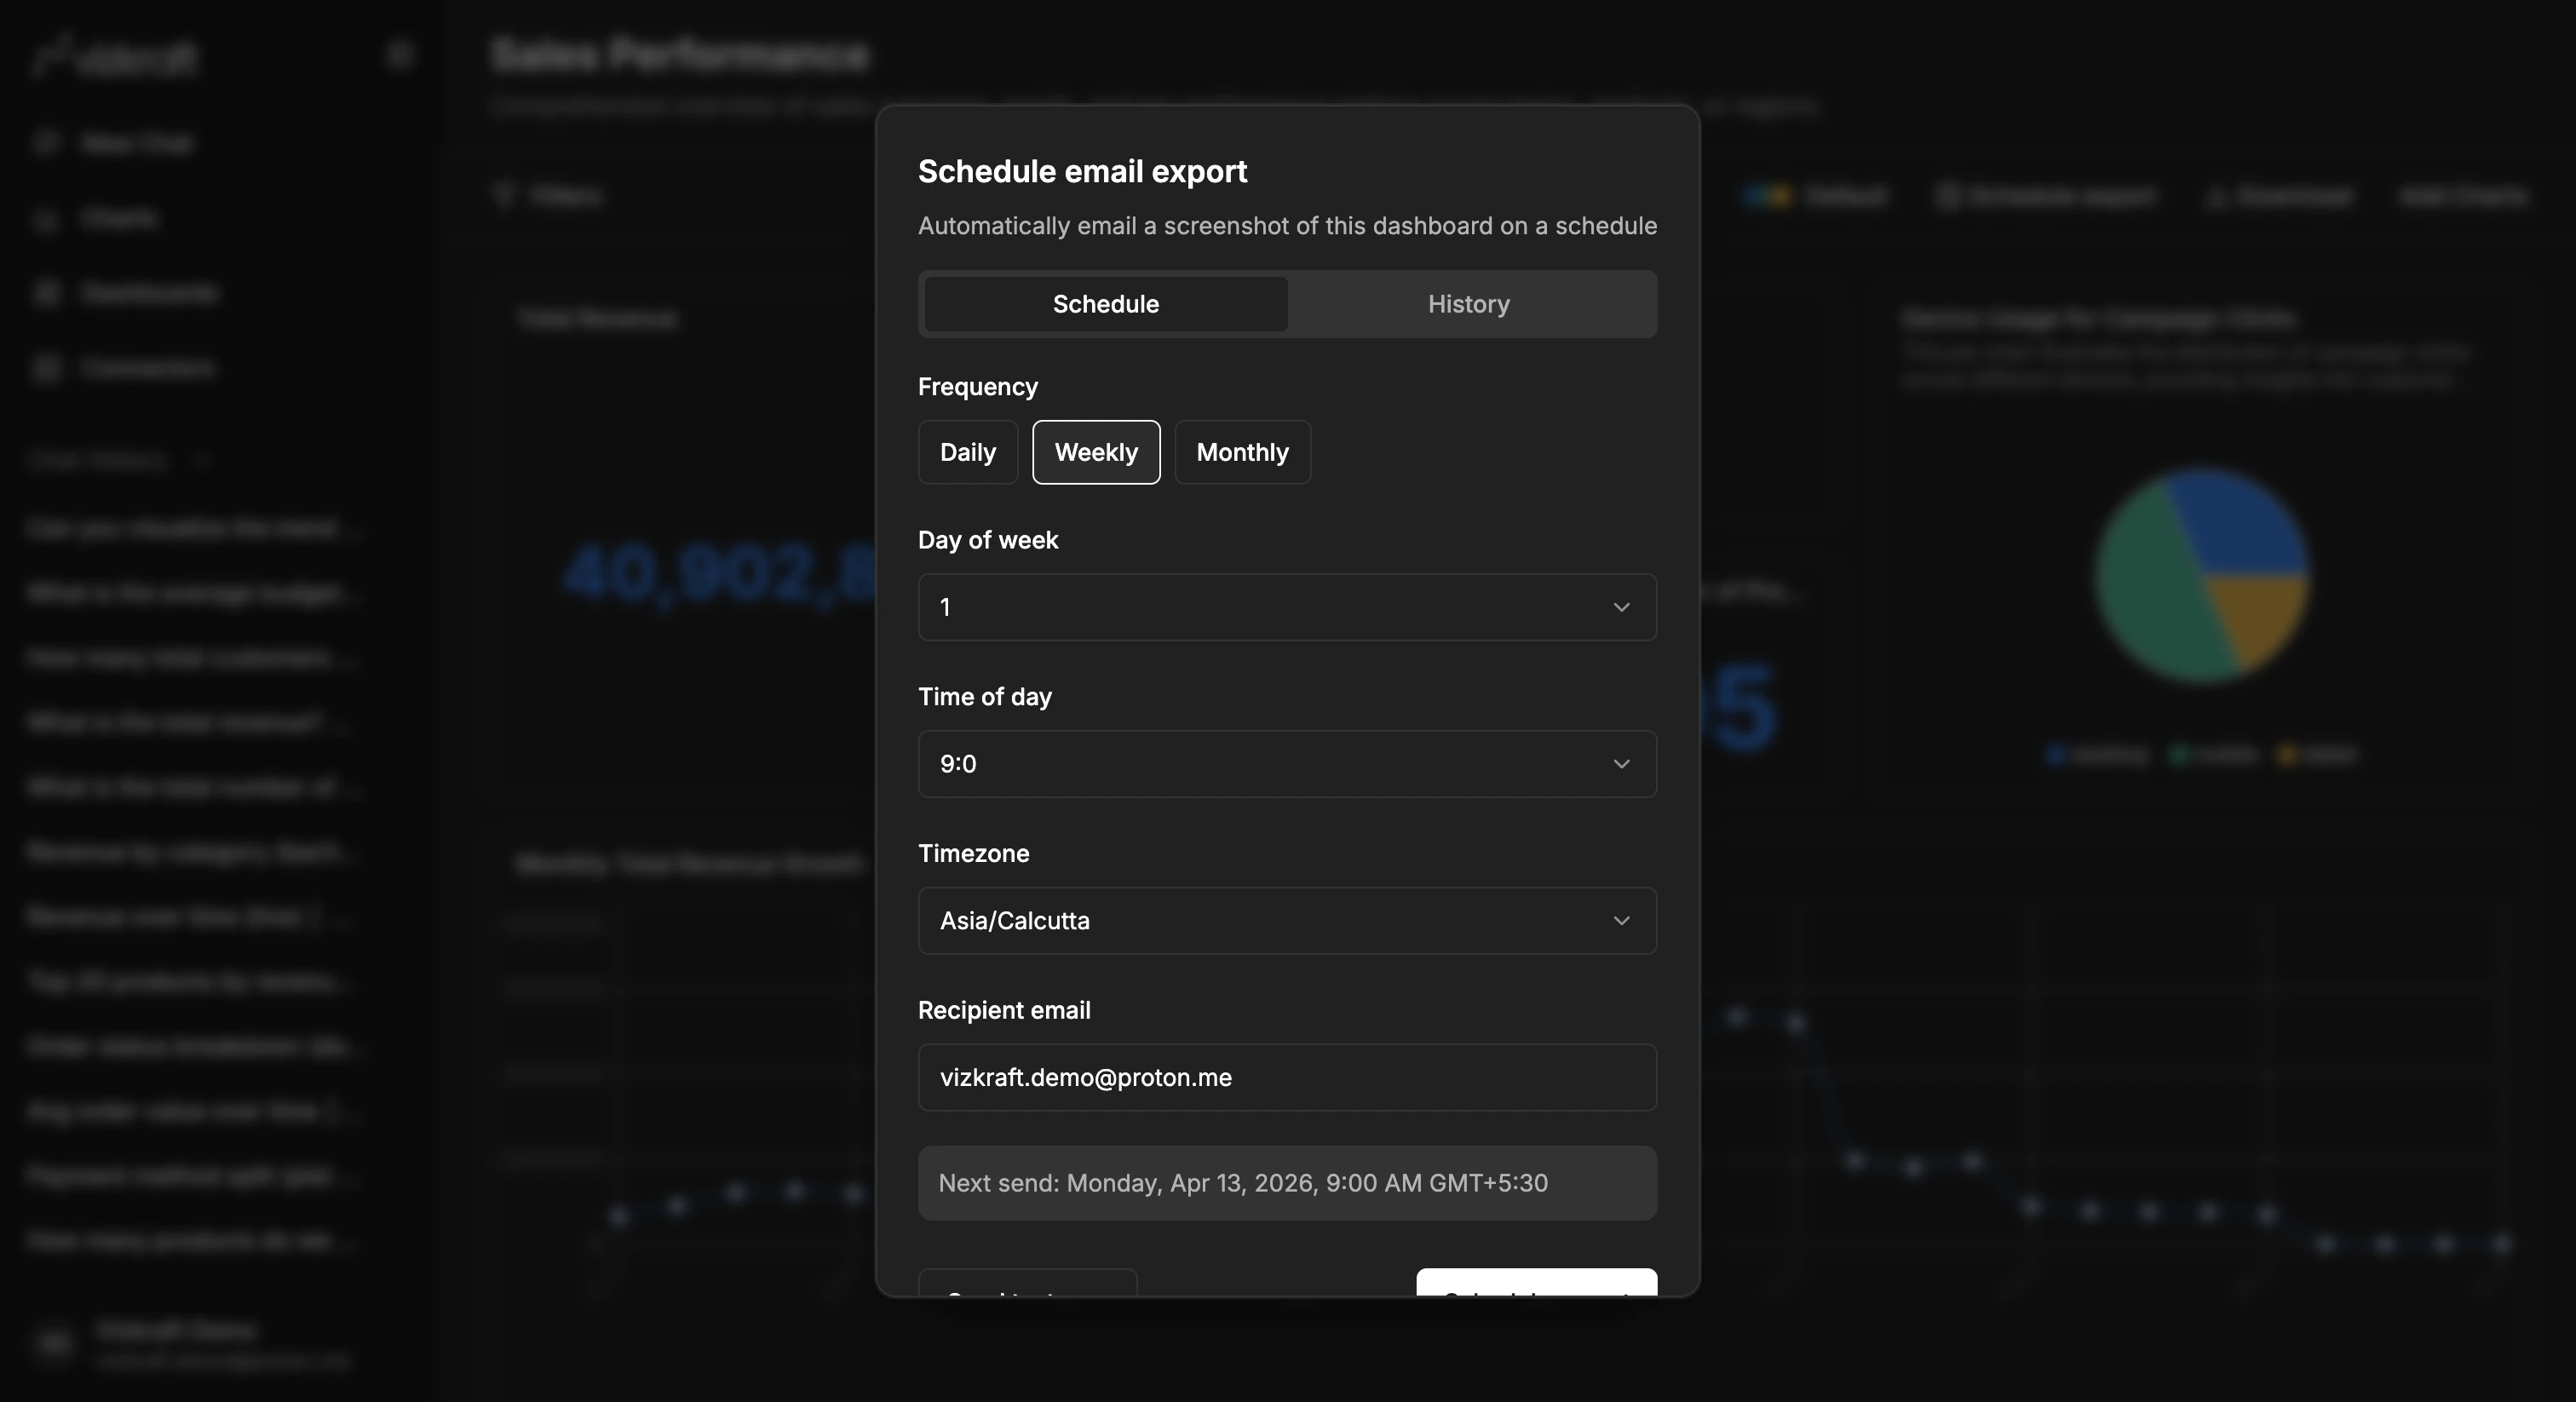
If your workflow includes regular sharing, use scheduled exports so the dashboard can be sent automatically on a recurring basis.
From the filter panel:
1. Open the **Smart filters** section.
2. Review suggested filter badges (for example, a high-value segment or recent time window).
3. Click a badge to configure and apply it.
4. Use **Regenerate smart filters** if your dashboard layout changed or you added new charts.
Smart filters that are already applied are hidden from the suggestion list so you do not duplicate them.
## Save a dashboard view
Use saved views when the same dashboard needs multiple versions.
Saving a view preserves the filter state so you can return to it later without rebuilding the setup by hand.
### Example: campaign performance dashboard
Imagine you have a `Campaign performance` dashboard and you add `campaign name` as a dashboard filter.
You could then create saved views like:
* `Spring sale 2025`
* `Holiday retargeting`
* `Black Friday launch`
* `Summer clearance`
* `Always-on brand campaigns`
Each saved view keeps the selected filter state for that campaign. That means a user can open the dashboard later, choose the saved view they want, and immediately see the dashboard with the right campaign filter already applied.
## Schedule exports
If your workflow includes regular sharing, use scheduled exports so the dashboard can be sent automatically on a recurring basis.
 ## Download a dashboard on demand
You can also download the current dashboard manually as:
* PNG
* PDF
This is useful when you want a snapshot for a deck, status update, or ad hoc share-out.
## Extra chart controls inside dashboards
From an individual chart inside a dashboard, you can also:
* Open a larger chart view.
* Toggle table view.
* Refresh live charts.
* Remove a chart from the dashboard while keeping it in the chart library.
## Tips
* Use filters before duplicating a dashboard.
* Try AI filters for quick slices, then save a view when you find a combination you reuse often.
* Regenerate smart filters after adding or removing charts.
* Save views with names that explain who or what they are for.
* Export after applying the exact filters your audience needs.
## Next step
Want Vizkraft to do more of the setup for you? Review [Suggested charts and dashboards](/features/suggested-charts-and-dashboards).
## Download a dashboard on demand
You can also download the current dashboard manually as:
* PNG
* PDF
This is useful when you want a snapshot for a deck, status update, or ad hoc share-out.
## Extra chart controls inside dashboards
From an individual chart inside a dashboard, you can also:
* Open a larger chart view.
* Toggle table view.
* Refresh live charts.
* Remove a chart from the dashboard while keeping it in the chart library.
## Tips
* Use filters before duplicating a dashboard.
* Try AI filters for quick slices, then save a view when you find a combination you reuse often.
* Regenerate smart filters after adding or removing charts.
* Save views with names that explain who or what they are for.
* Export after applying the exact filters your audience needs.
## Next step
Want Vizkraft to do more of the setup for you? Review [Suggested charts and dashboards](/features/suggested-charts-and-dashboards).