What you can do in Vizkraft
- Add connectors for PostgreSQL, MySQL, ClickHouse, MongoDB, HubSpot CRM, and custom MCP servers.
- Index SQL and MongoDB sources, or sync HubSpot CRM catalogs.
- Ask questions in chat and keep the conversation going with follow-up prompts.
- Rate answers with thumbs up or thumbs down to improve accuracy over time.
- Build connector memory that persists across your organization.
- Run evaluation to measure and improve answer quality for SQL connectors.
- Create charts from answers, save them, refine them manually or with AI edit.
- Build dashboards with manual filters, AI filters, smart filters, saved views, and exports.
- Review suggested charts and dashboards that Vizkraft prepares after a connector is analyzed.
- Work from the web app and, if enabled for your workspace, from Slack.
Your main workspace areas
| Area | What it is for |
|---|---|
| Chat | Ask questions, review answers, rate responses, and generate charts. |
| Connectors | Add sources, run indexing or CRM sync, open memory and evaluation. |
| Charts | Browse saved charts and review suggested charts. |
| Dashboards | Create dashboards, add saved charts, and manage suggested dashboards. |
| Preferences | Update theme, language, and Slack settings. |
See the main workspace
This view shows the main app shell, including the left navigation and the suggested question state many users see when starting a new chat.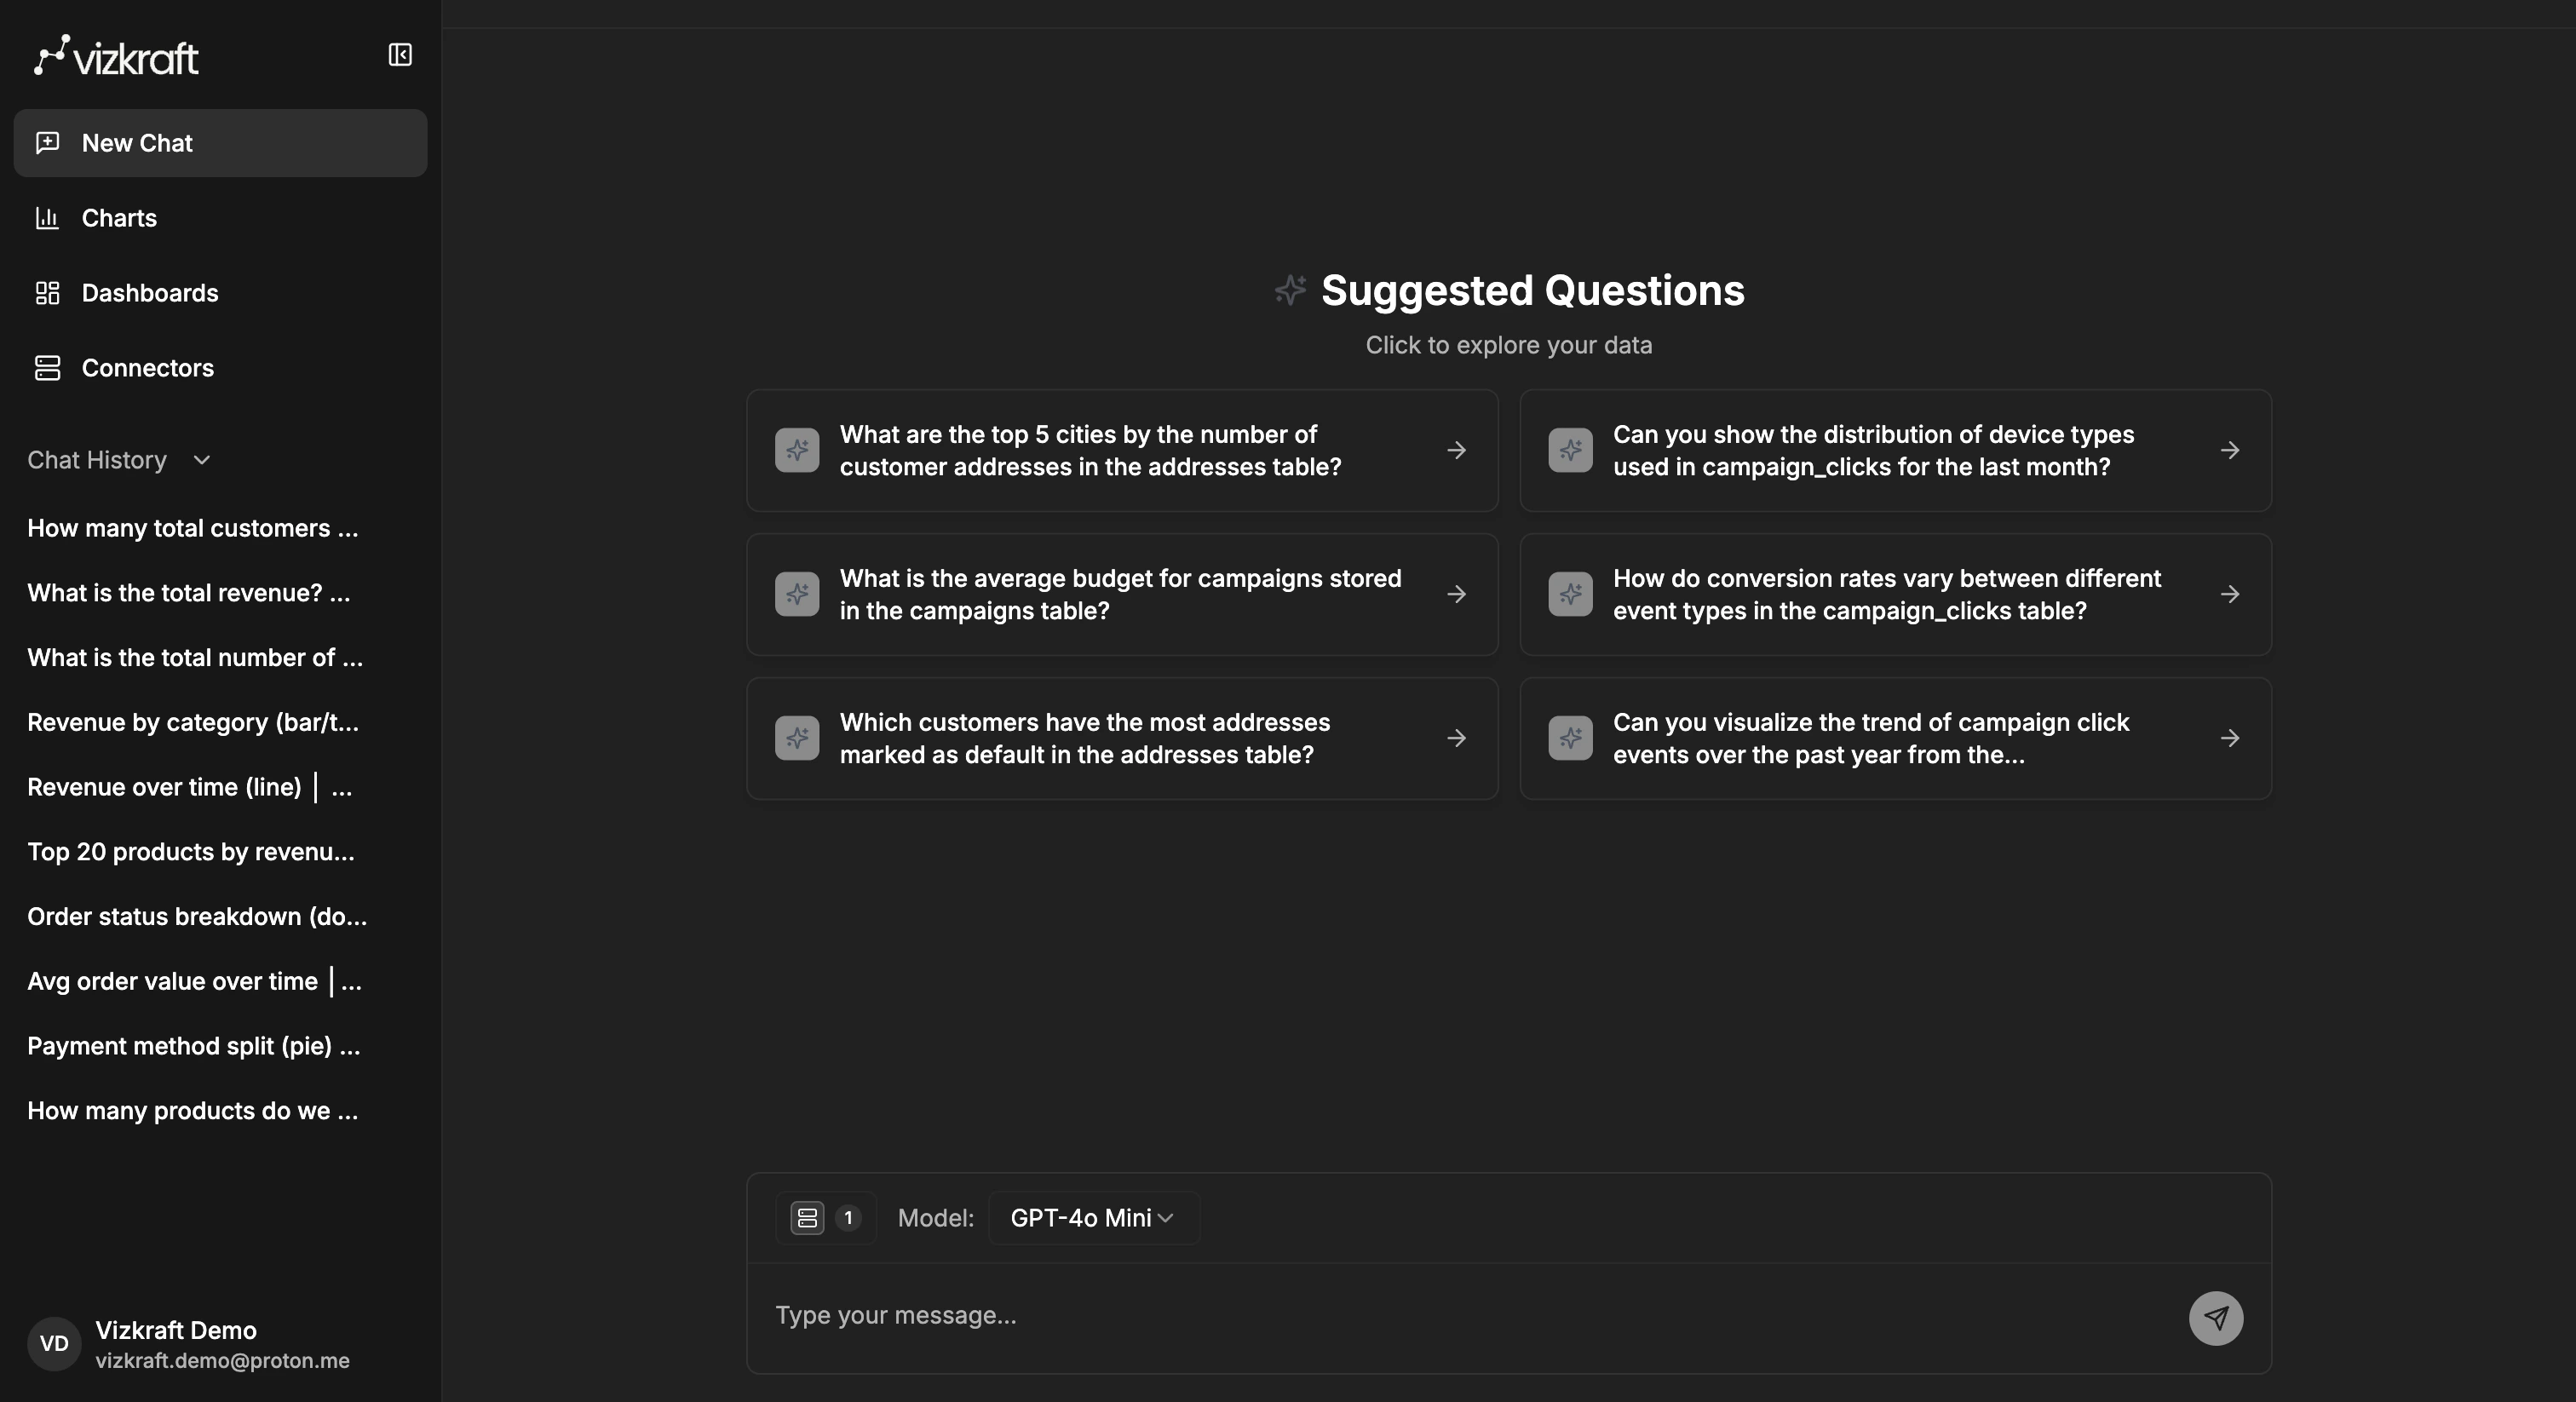
Typical workflow
- Add a connector in the
Connectorsarea. - Run indexing or HubSpot catalog sync so Vizkraft understands your data.
- Open
Chatand pick the connector or connectors you want to use. - Ask a question, then use follow-up suggestions or type the next question yourself.
- Rate helpful answers and review any memory updates Vizkraft saves.
- Save useful charts to your library.
- Add charts to dashboards, apply filters (including AI filters), and save views for recurring use.
- Review suggested charts and dashboards when Vizkraft prepares them for you.
- Optionally run evaluation on SQL connectors to measure and improve accuracy.
What to expect on day one
- If you open chat before asking anything, Vizkraft can show sample suggested questions in the empty state.
- After an answer is generated, follow-up suggestions can appear above the message input so you can continue the same thread.
- Memory notifications can appear when Vizkraft learns something about your connector.
- Suggested charts and dashboards appear in their respective library pages after a connector has been analyzed.
Next steps
- Start with Get started for a quick tour of the product.
- Go to Add connectors when you are ready to connect data.
- Read Connector memory to understand how Vizkraft learns over time.
- Read Ask questions to learn the core chat workflow.