Start in the sidebar
Most teams use these areas every day:| Section | What you will do there |
|---|---|
Chat | Ask questions, rate answers, and generate charts. |
Connectors | Add data sources, run indexing or CRM sync, open memory and evaluation. |
Charts | Review saved charts and keep or dismiss suggested charts. |
Dashboards | Create dashboards, manage suggested dashboards, and open saved dashboards. |
Preferences | Change theme and language, and connect Slack if your workspace uses it. |
Your first successful workflow
- Add a connector — SQL, MongoDB, or HubSpot.
- Run indexing or HubSpot catalog sync so Vizkraft reads your data structure.
- Go to chat and select the connector you want to use.
- Ask a business question in natural language.
- Rate the answer with thumbs up or down, and review any memory updates.
- Save the chart or charts you want to keep.
- Add saved charts to a dashboard.
- Apply filters or save a view if the dashboard will be reused.
- Optionally open Evaluation to measure accuracy and approve golden test cases.
What you will see right away
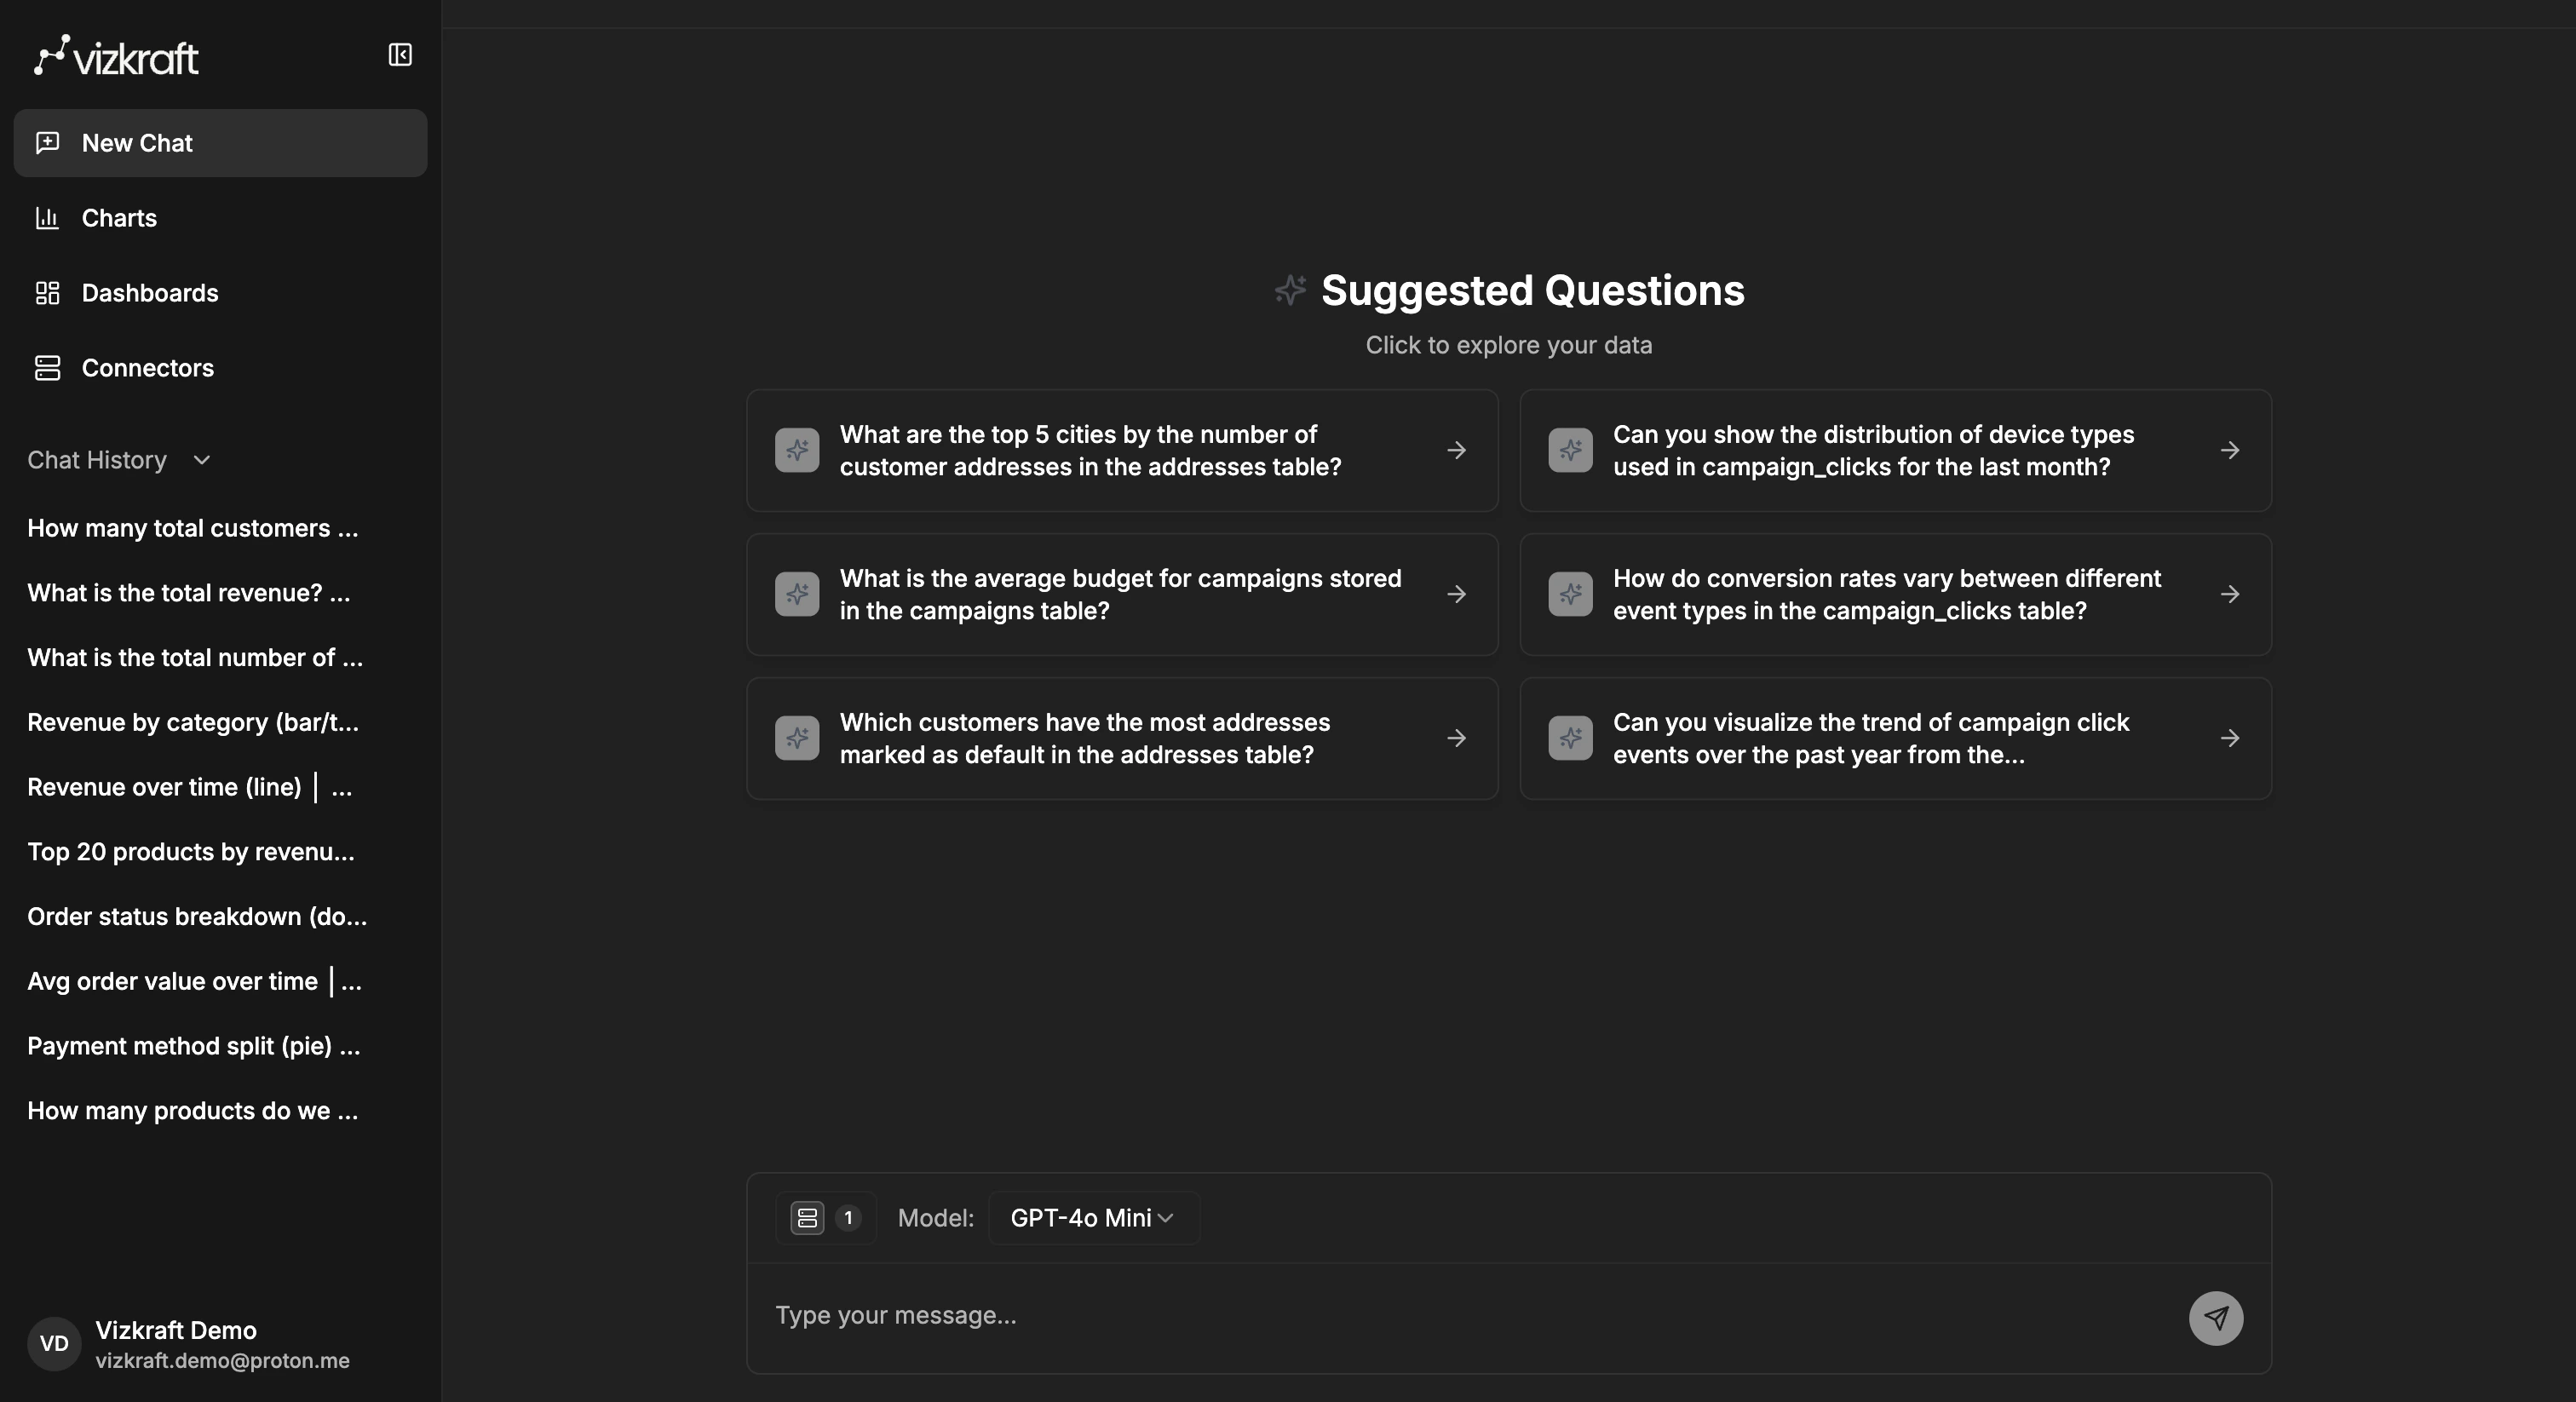
In chat
- An empty chat can show suggested sample questions to help you get started.
- You can choose one connector or multiple connectors before sending a question.
- Follow-up suggestions can appear after answers so you can continue without rewriting context.
- Thumbs up and thumbs down controls appear on SQL answers.
- Purple memory notifications appear when Vizkraft saves a learning about your connector.
In connectors
- Each connector row shows connection and indexing status.
- Indexing opens the schema workflow for SQL and MongoDB connectors.
- Catalog sync opens the HubSpot object catalog for CRM connectors.
- Memory and Evaluation are in the ⋯ menu.
In charts
- Saved charts live in your chart library.
- Suggested charts appear separately when Vizkraft has generated ideas from indexed data.
- You can switch between card and list views and search by chart title or description.
In dashboards
- You can create a new dashboard from the dashboards page.
- Saved charts can be added into dashboards and rearranged later.
- Suggested dashboards can appear after Vizkraft finishes analyzing a connector.
- AI filters and smart filters help you slice dashboards without manual setup.
Good first questions to ask
- What changed week over week in revenue?
- Which customers or regions are driving the highest growth?
- Show the top five products by sales this quarter.
- Build a chart of daily active users for the last 30 days.
- Compare conversion rate and spend by campaign.