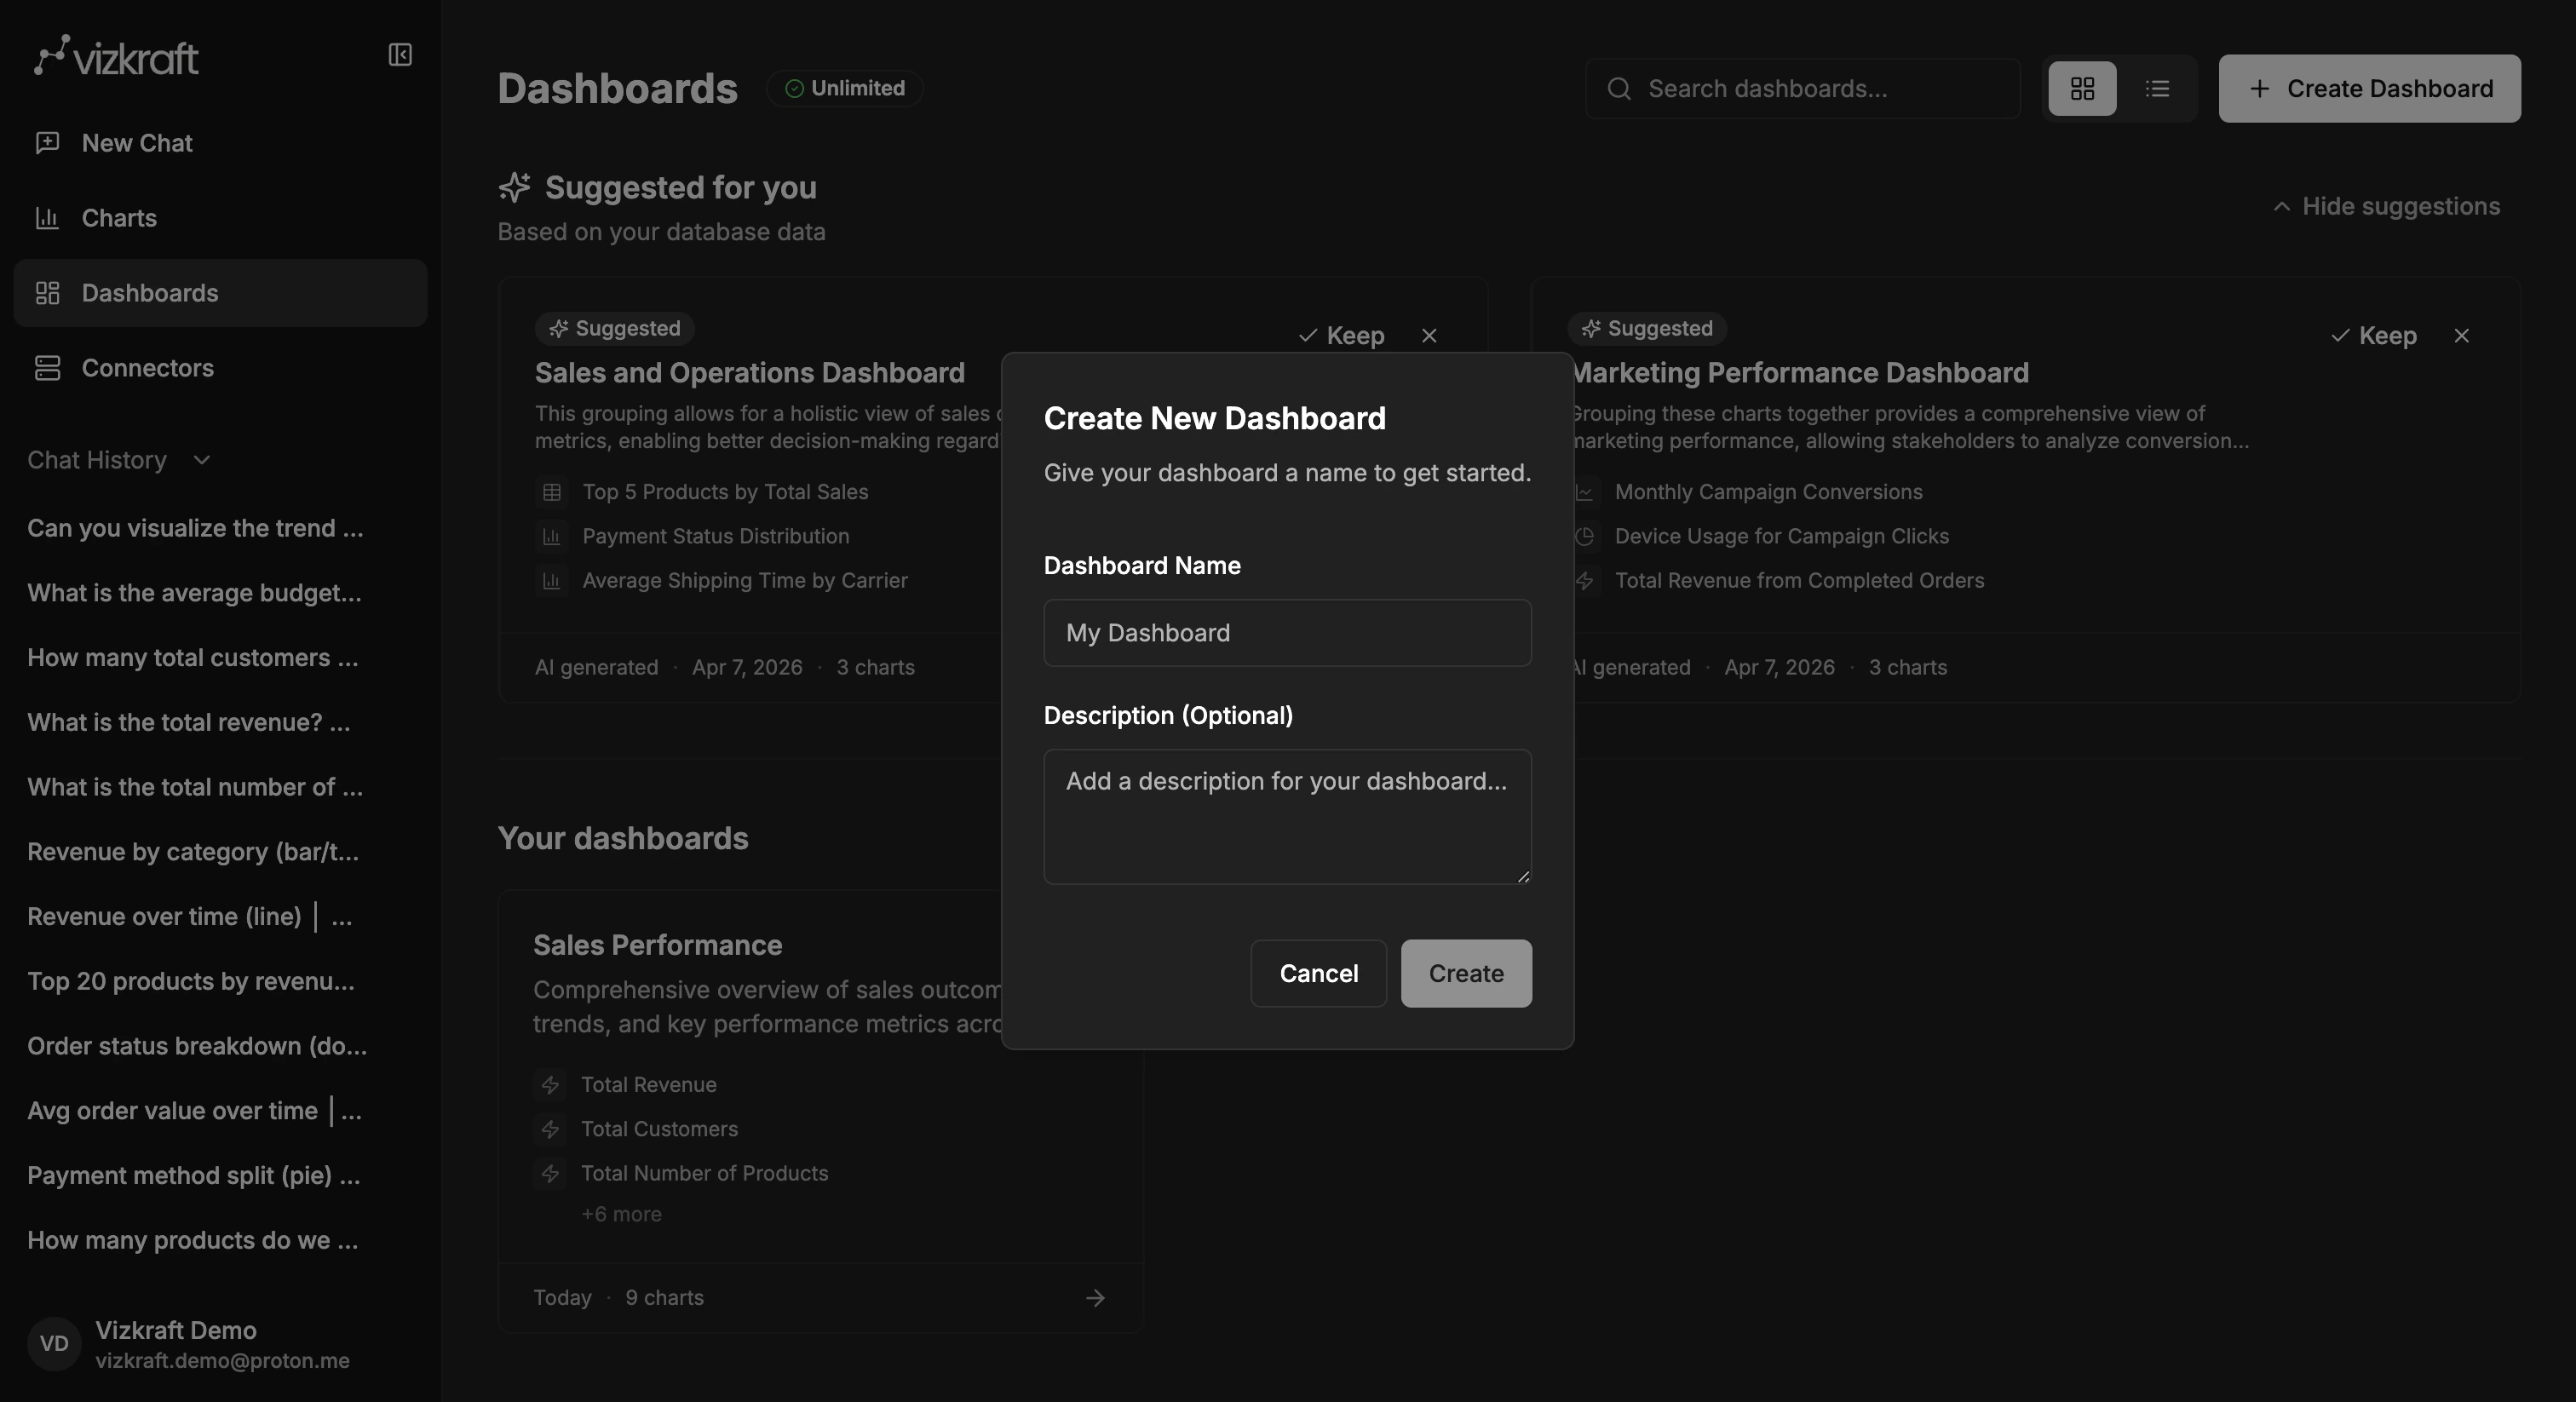
Create a new dashboard
- Open
Dashboards. - Select
Create dashboard. - Enter a name.
- Optionally add a description.
- Open the new dashboard.
Add charts to the dashboard
The best input for a dashboard is a chart you have already saved from chat. Before you build, make sure the charts you want are available in your chart library. Then add them to the dashboard and start arranging the layout.Arrange the layout
Inside the dashboard, you can:- Drag charts to new positions.
- Resize charts to give the most important metrics more room.
- Remove charts that do not belong in that story.
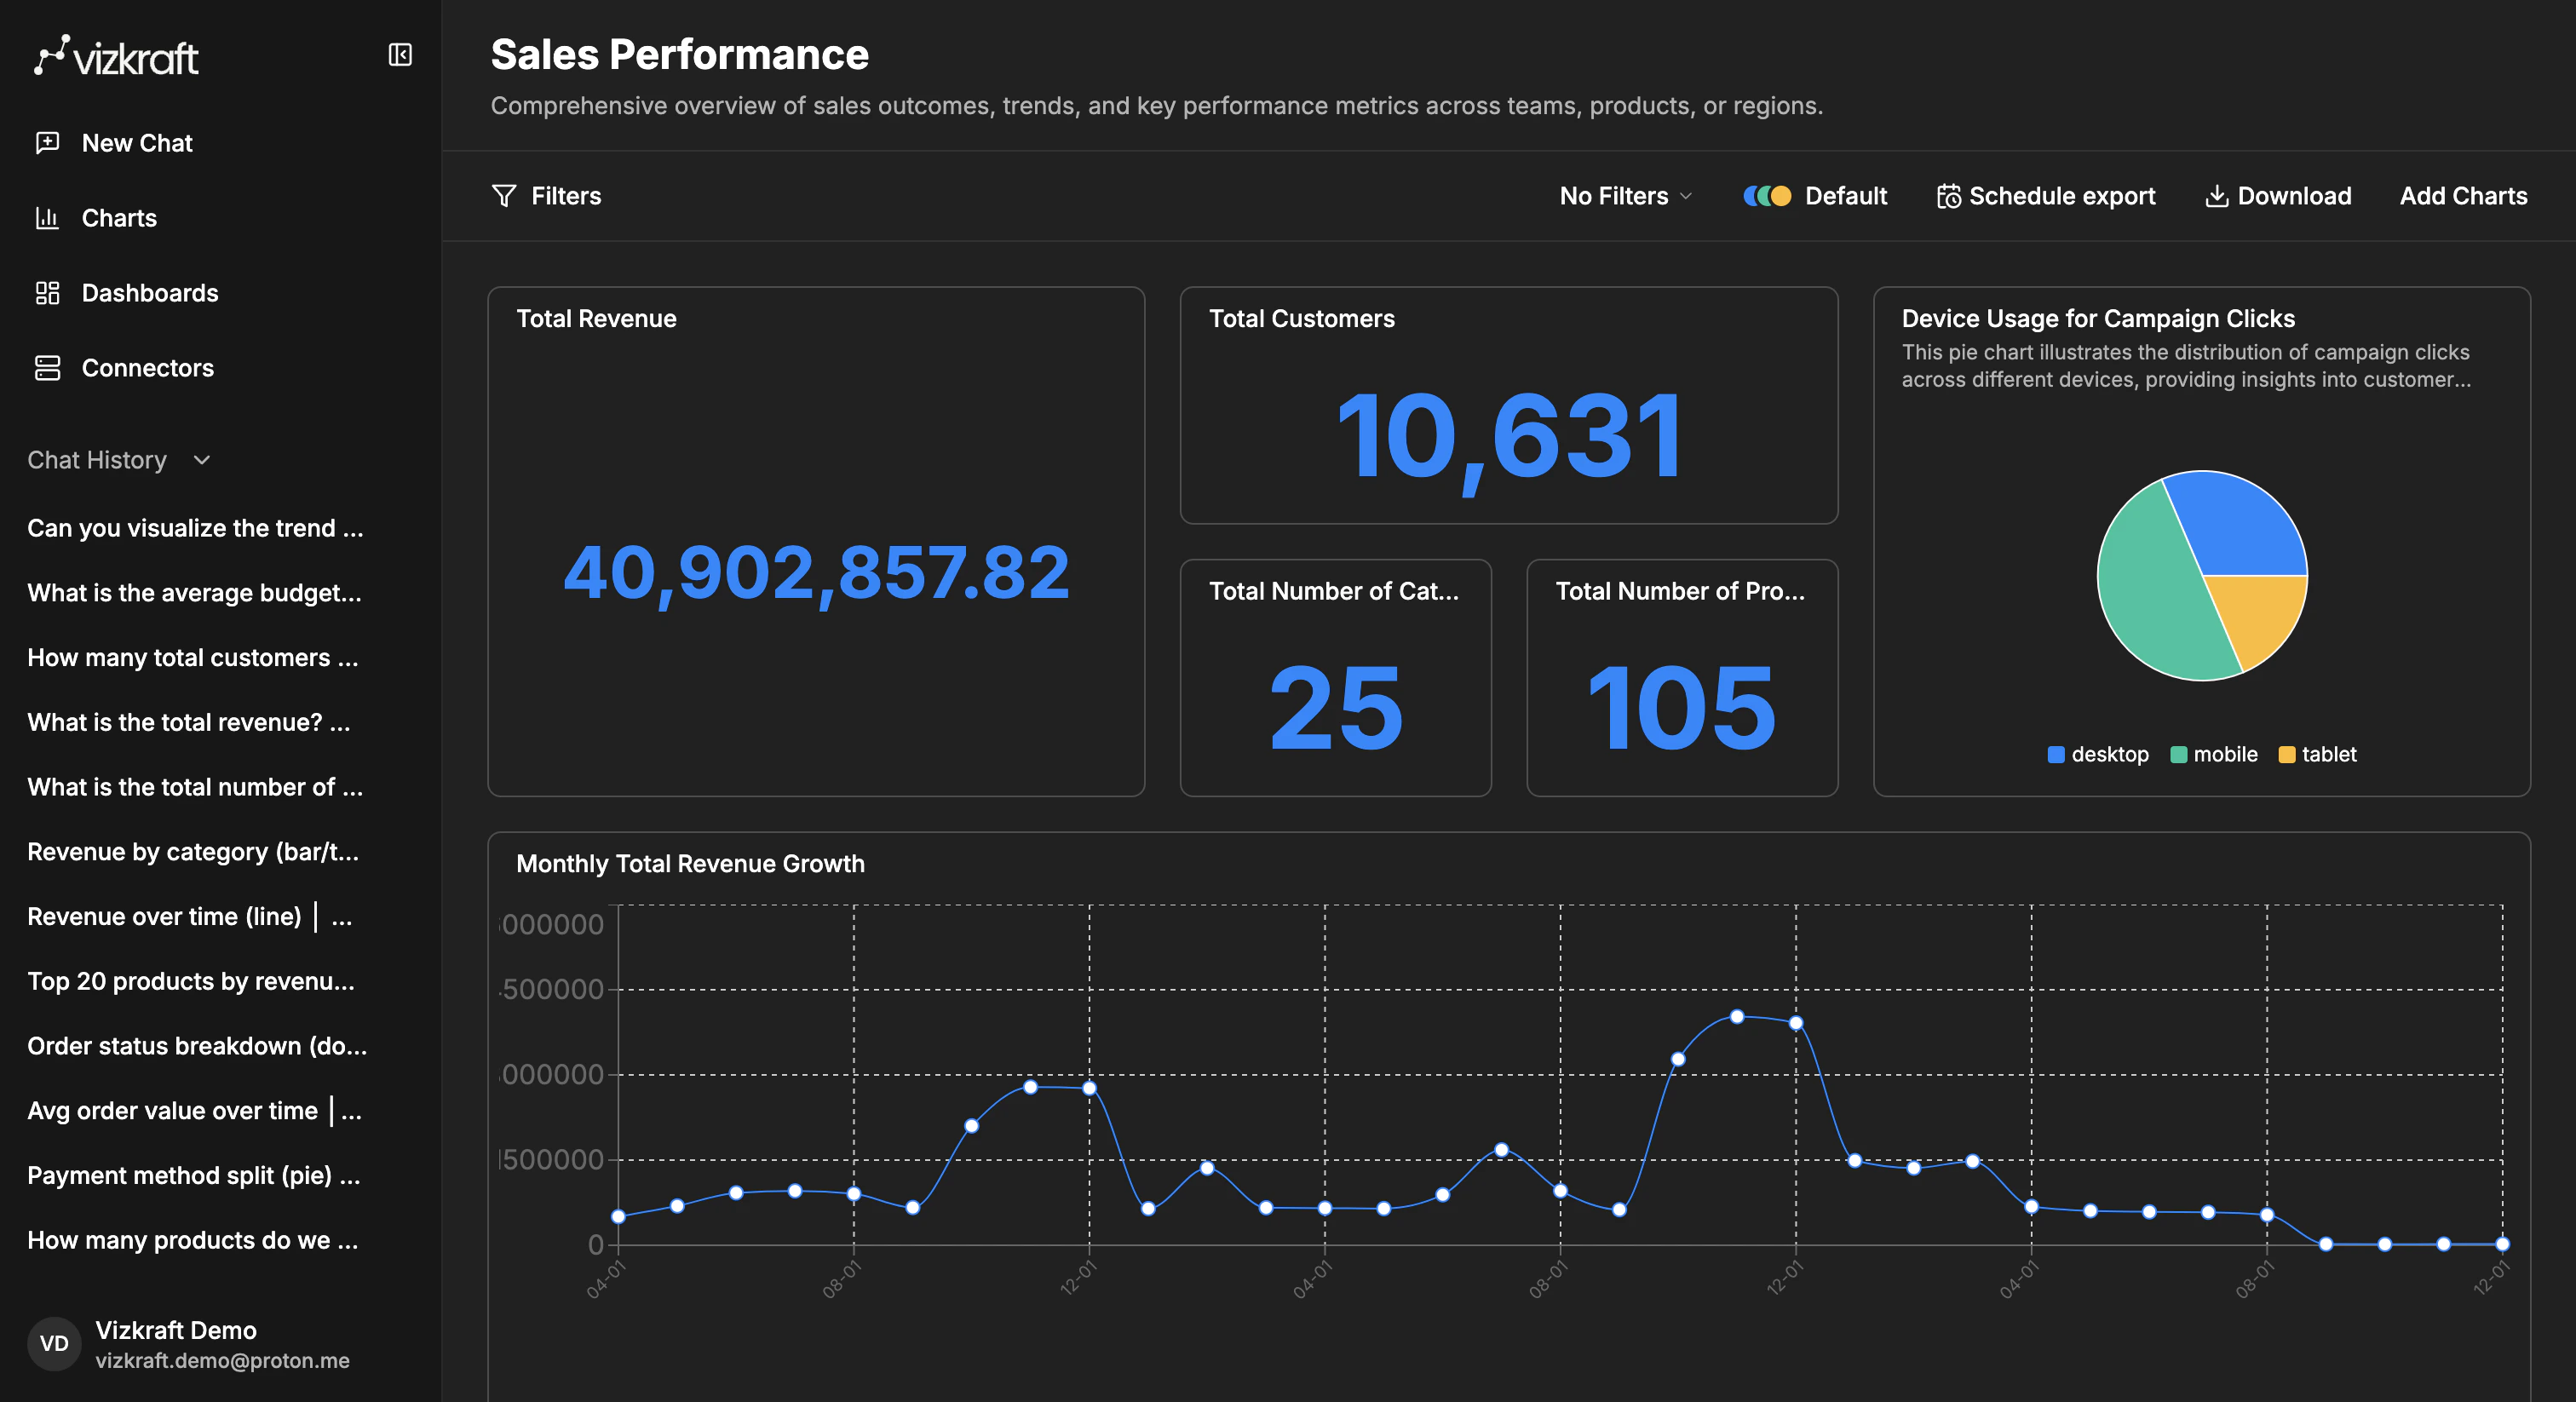
Use clear structure
A simple layout often works best:- Start with high-level KPIs or summary visuals at the top.
- Put trend and comparison charts in the middle.
- Leave detailed supporting charts or tables lower on the page.
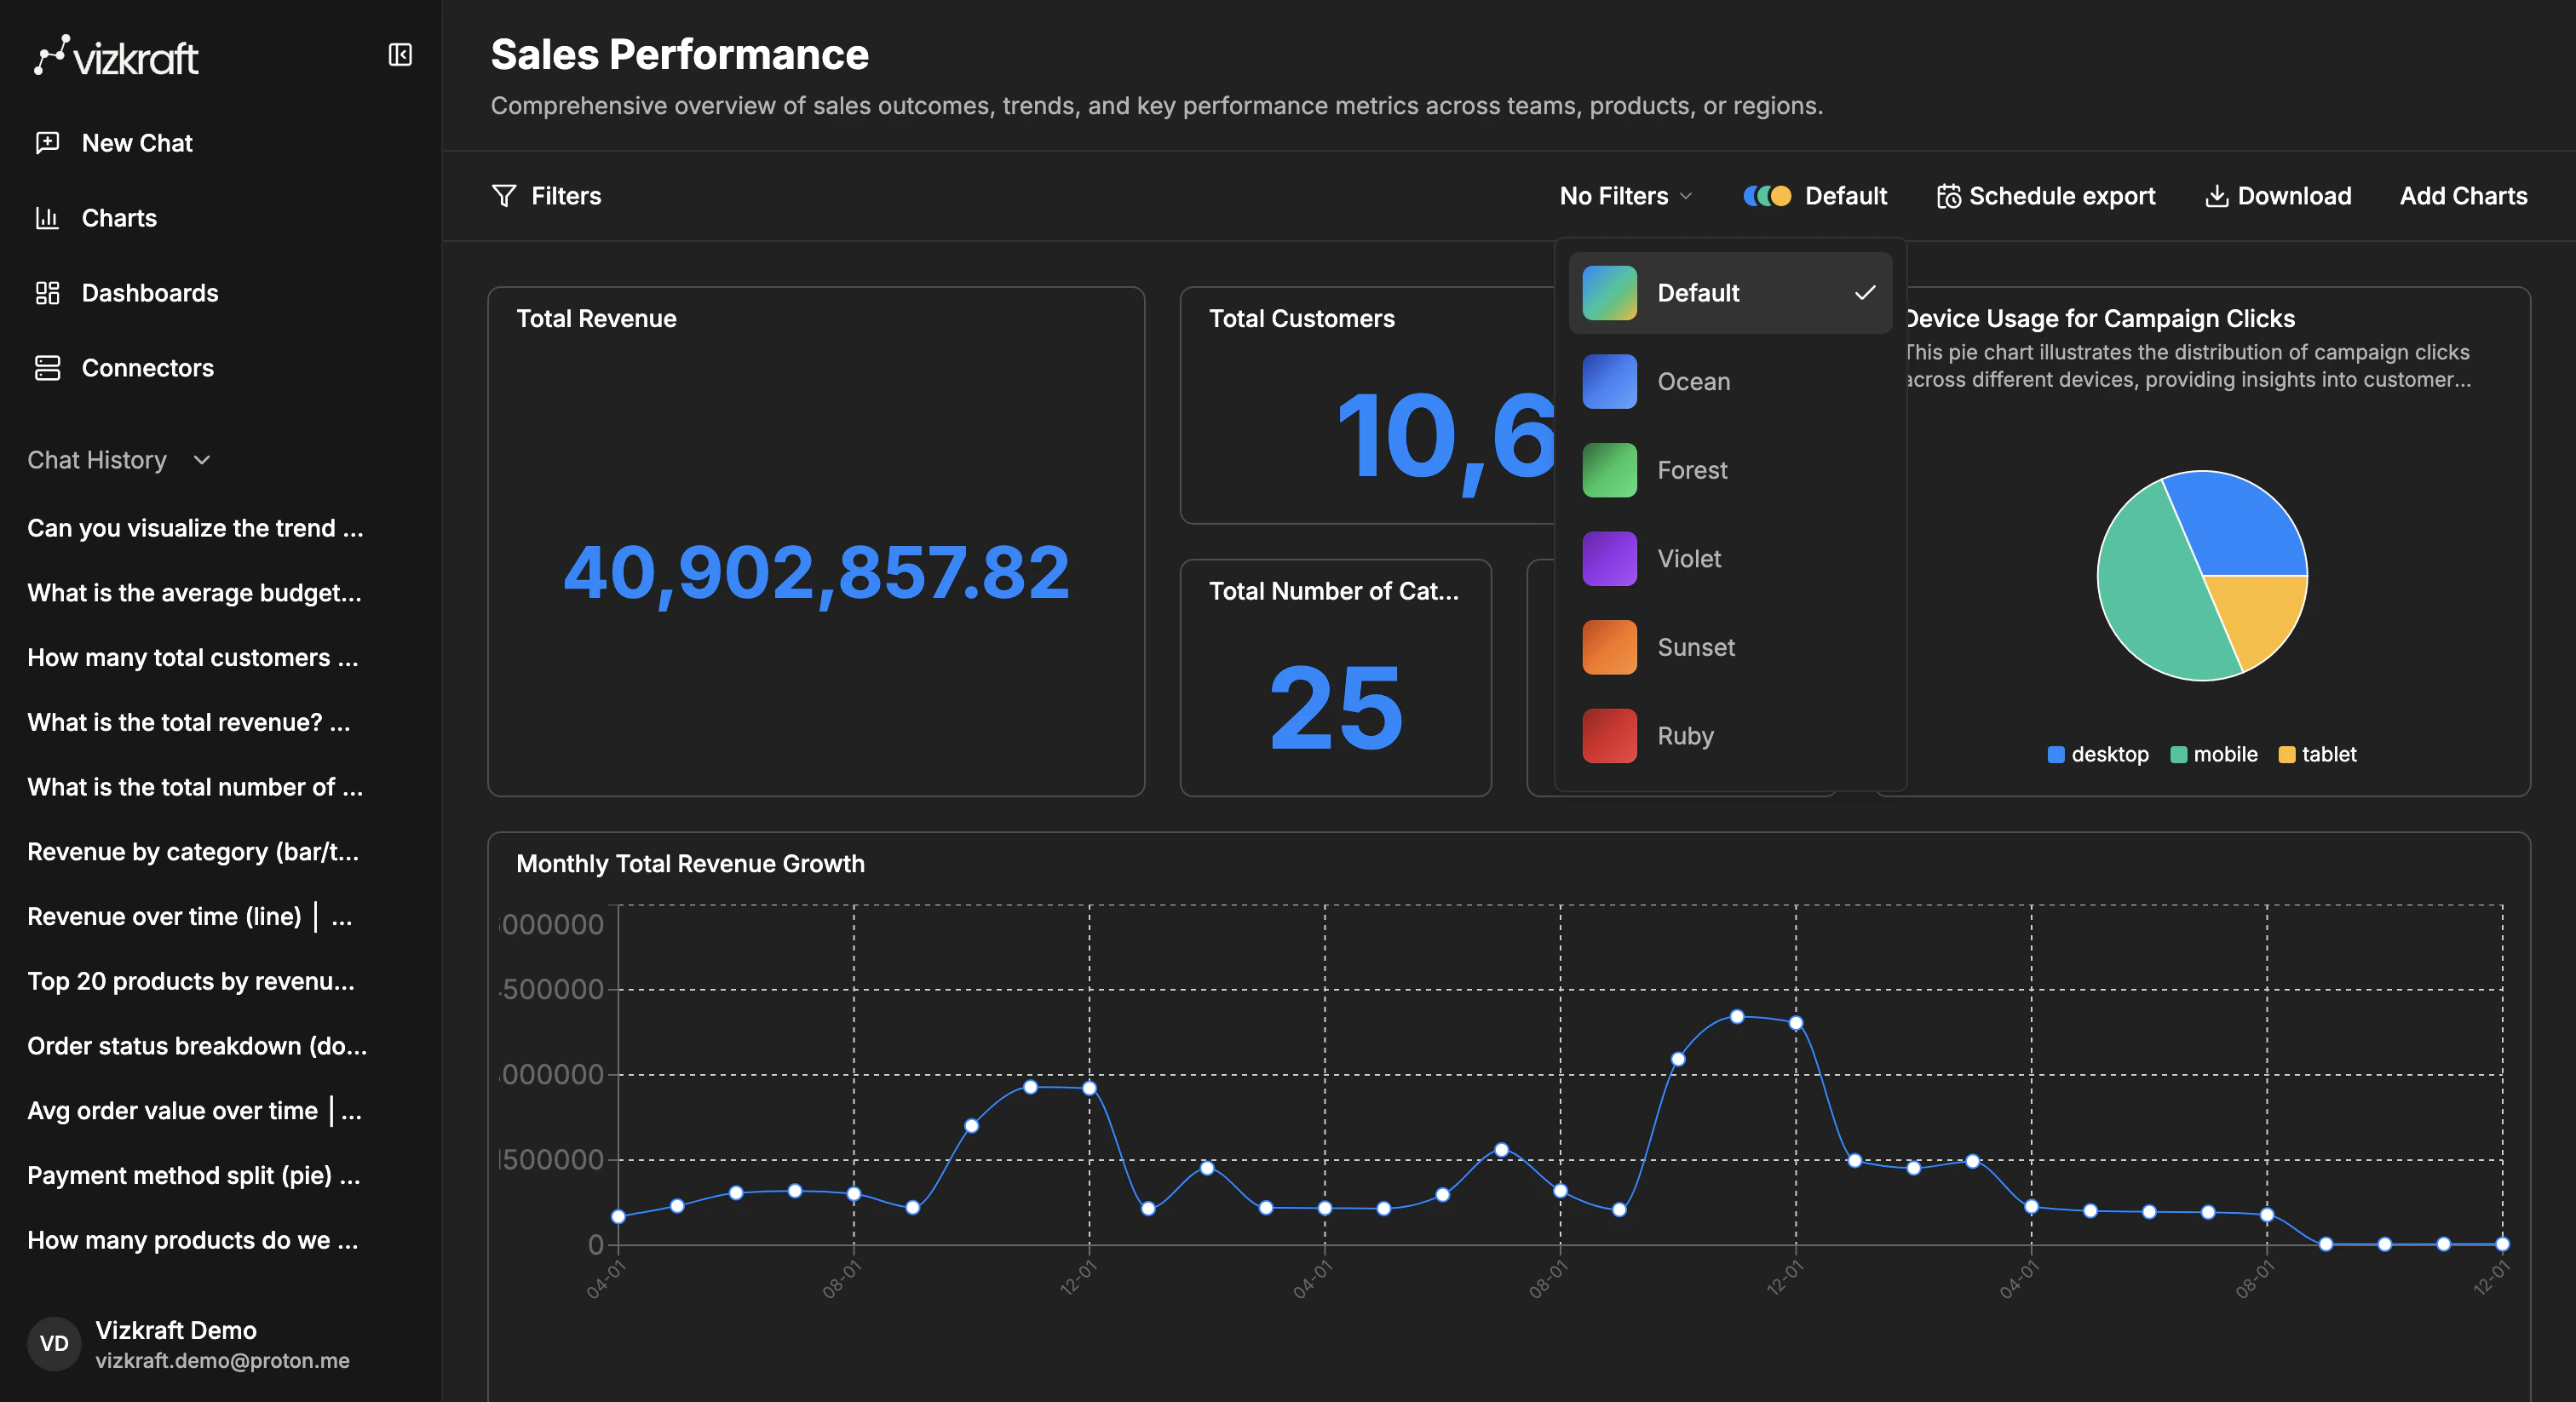
Use dashboard themes
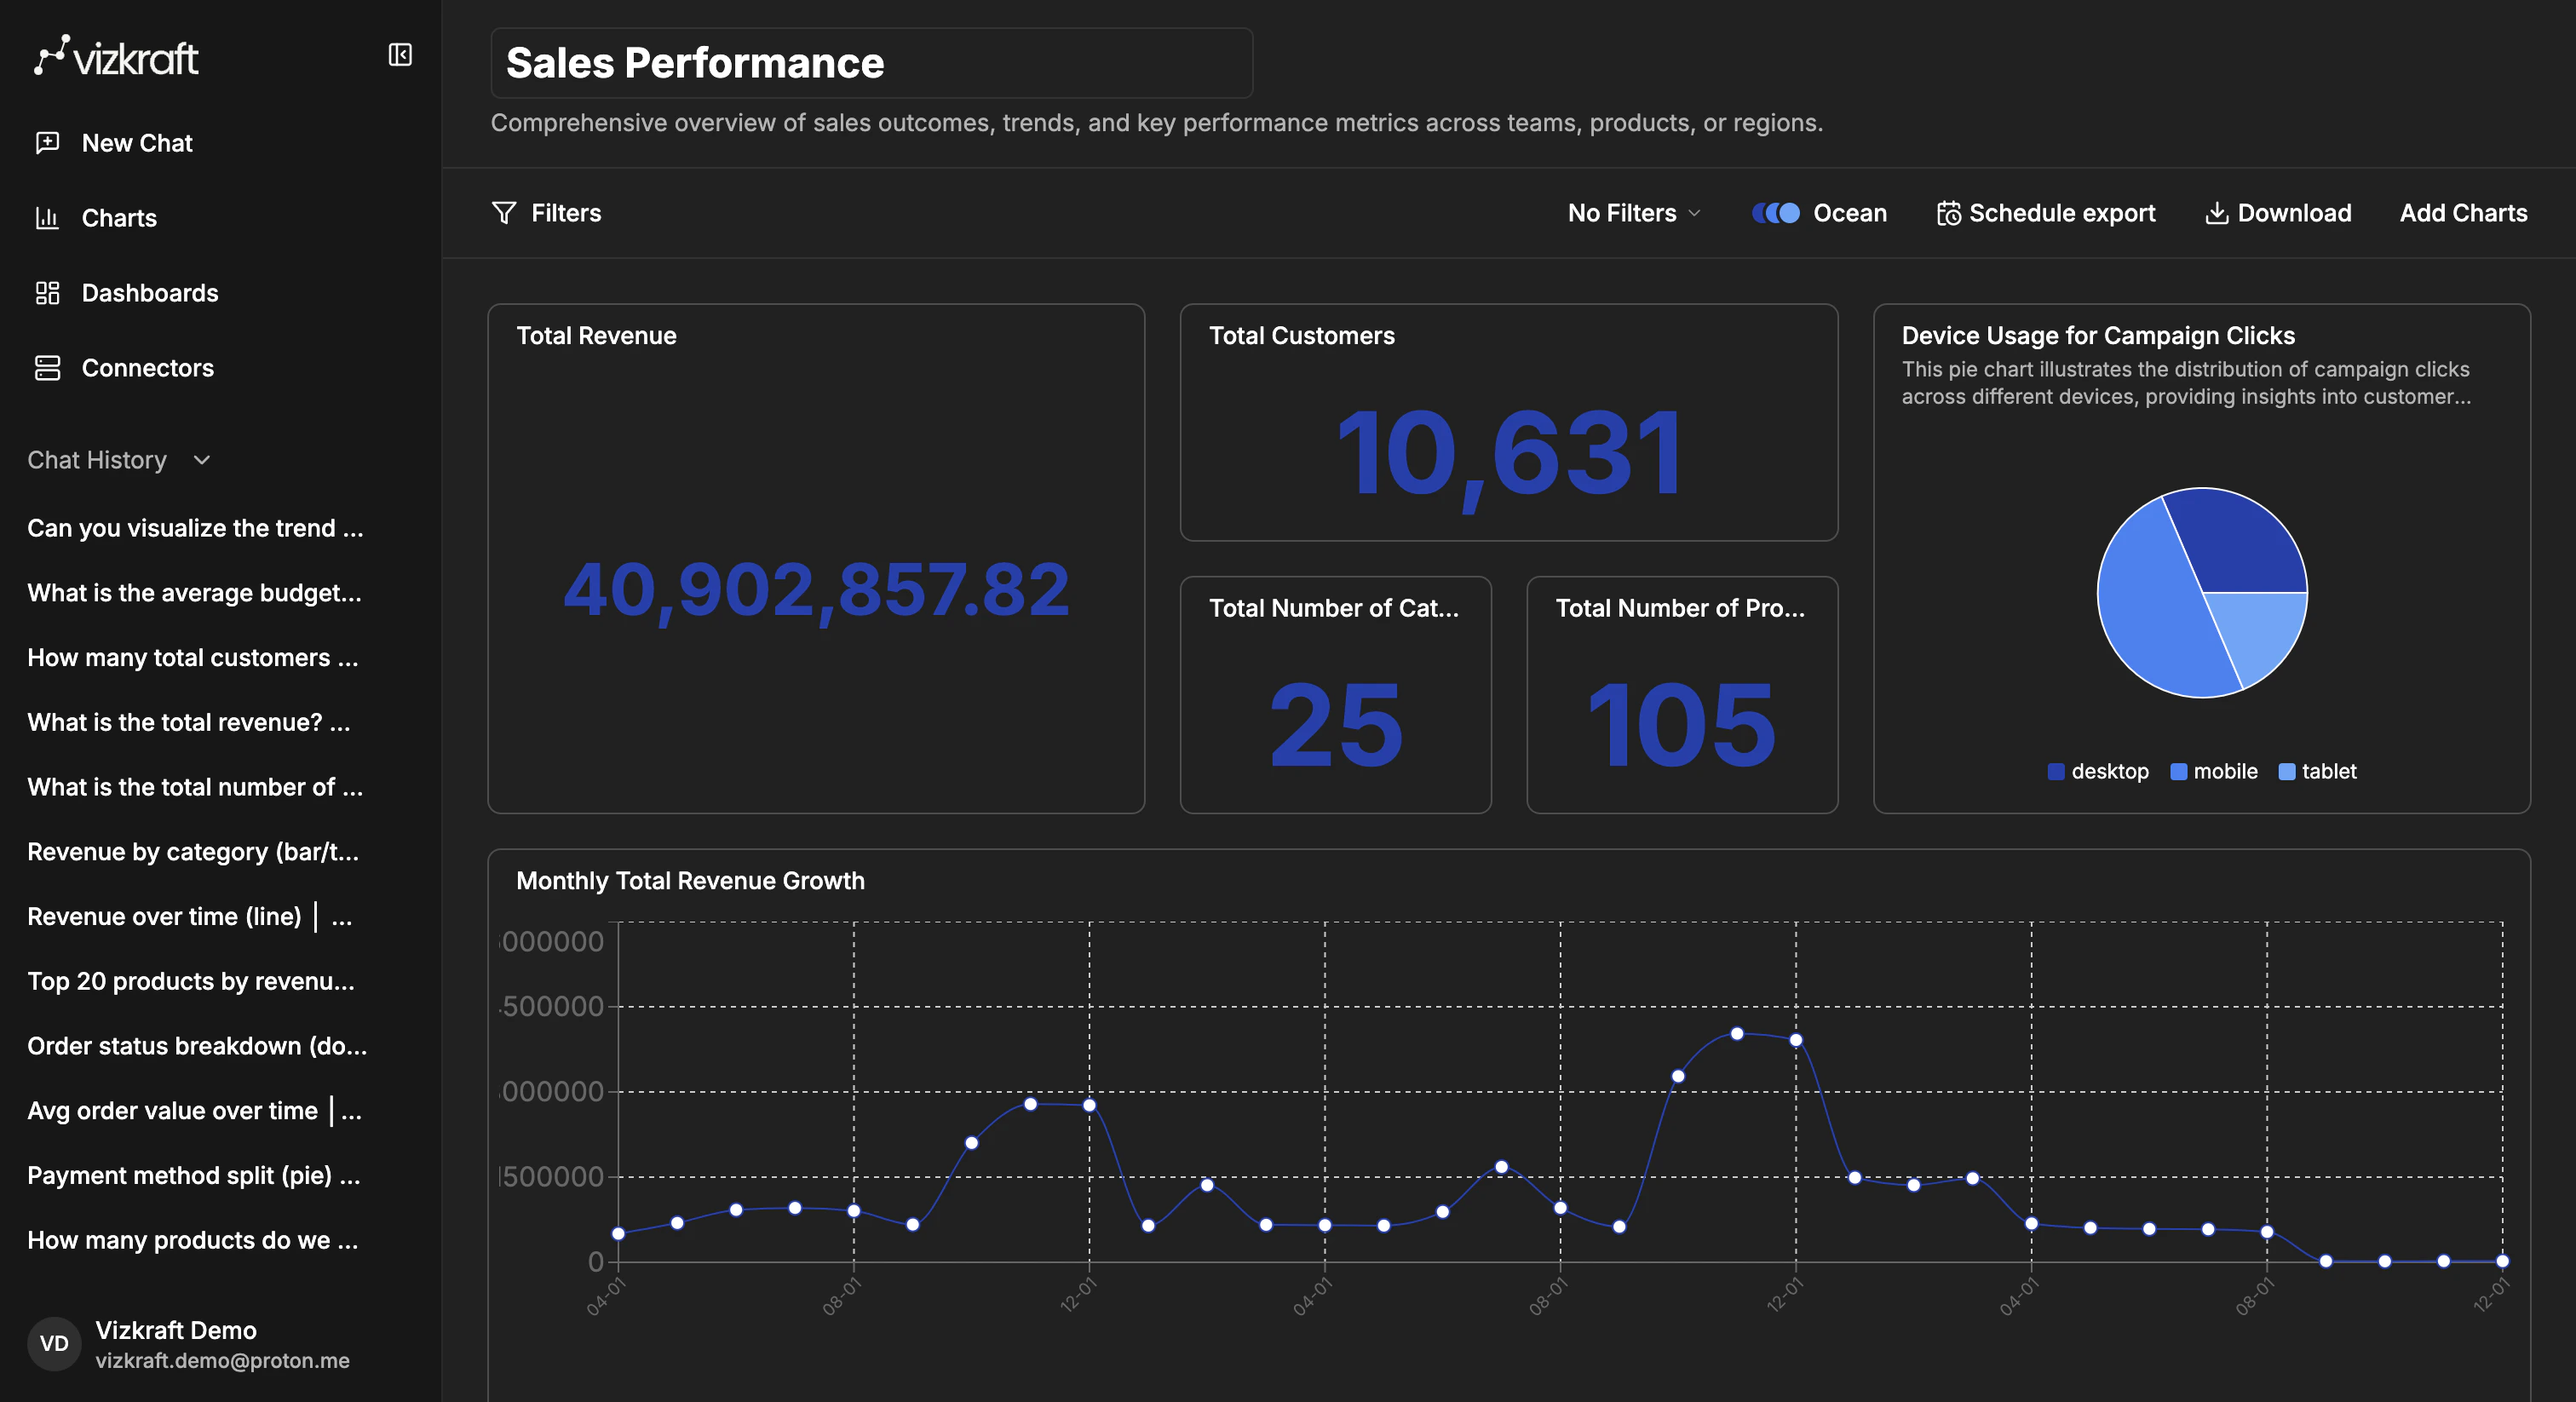
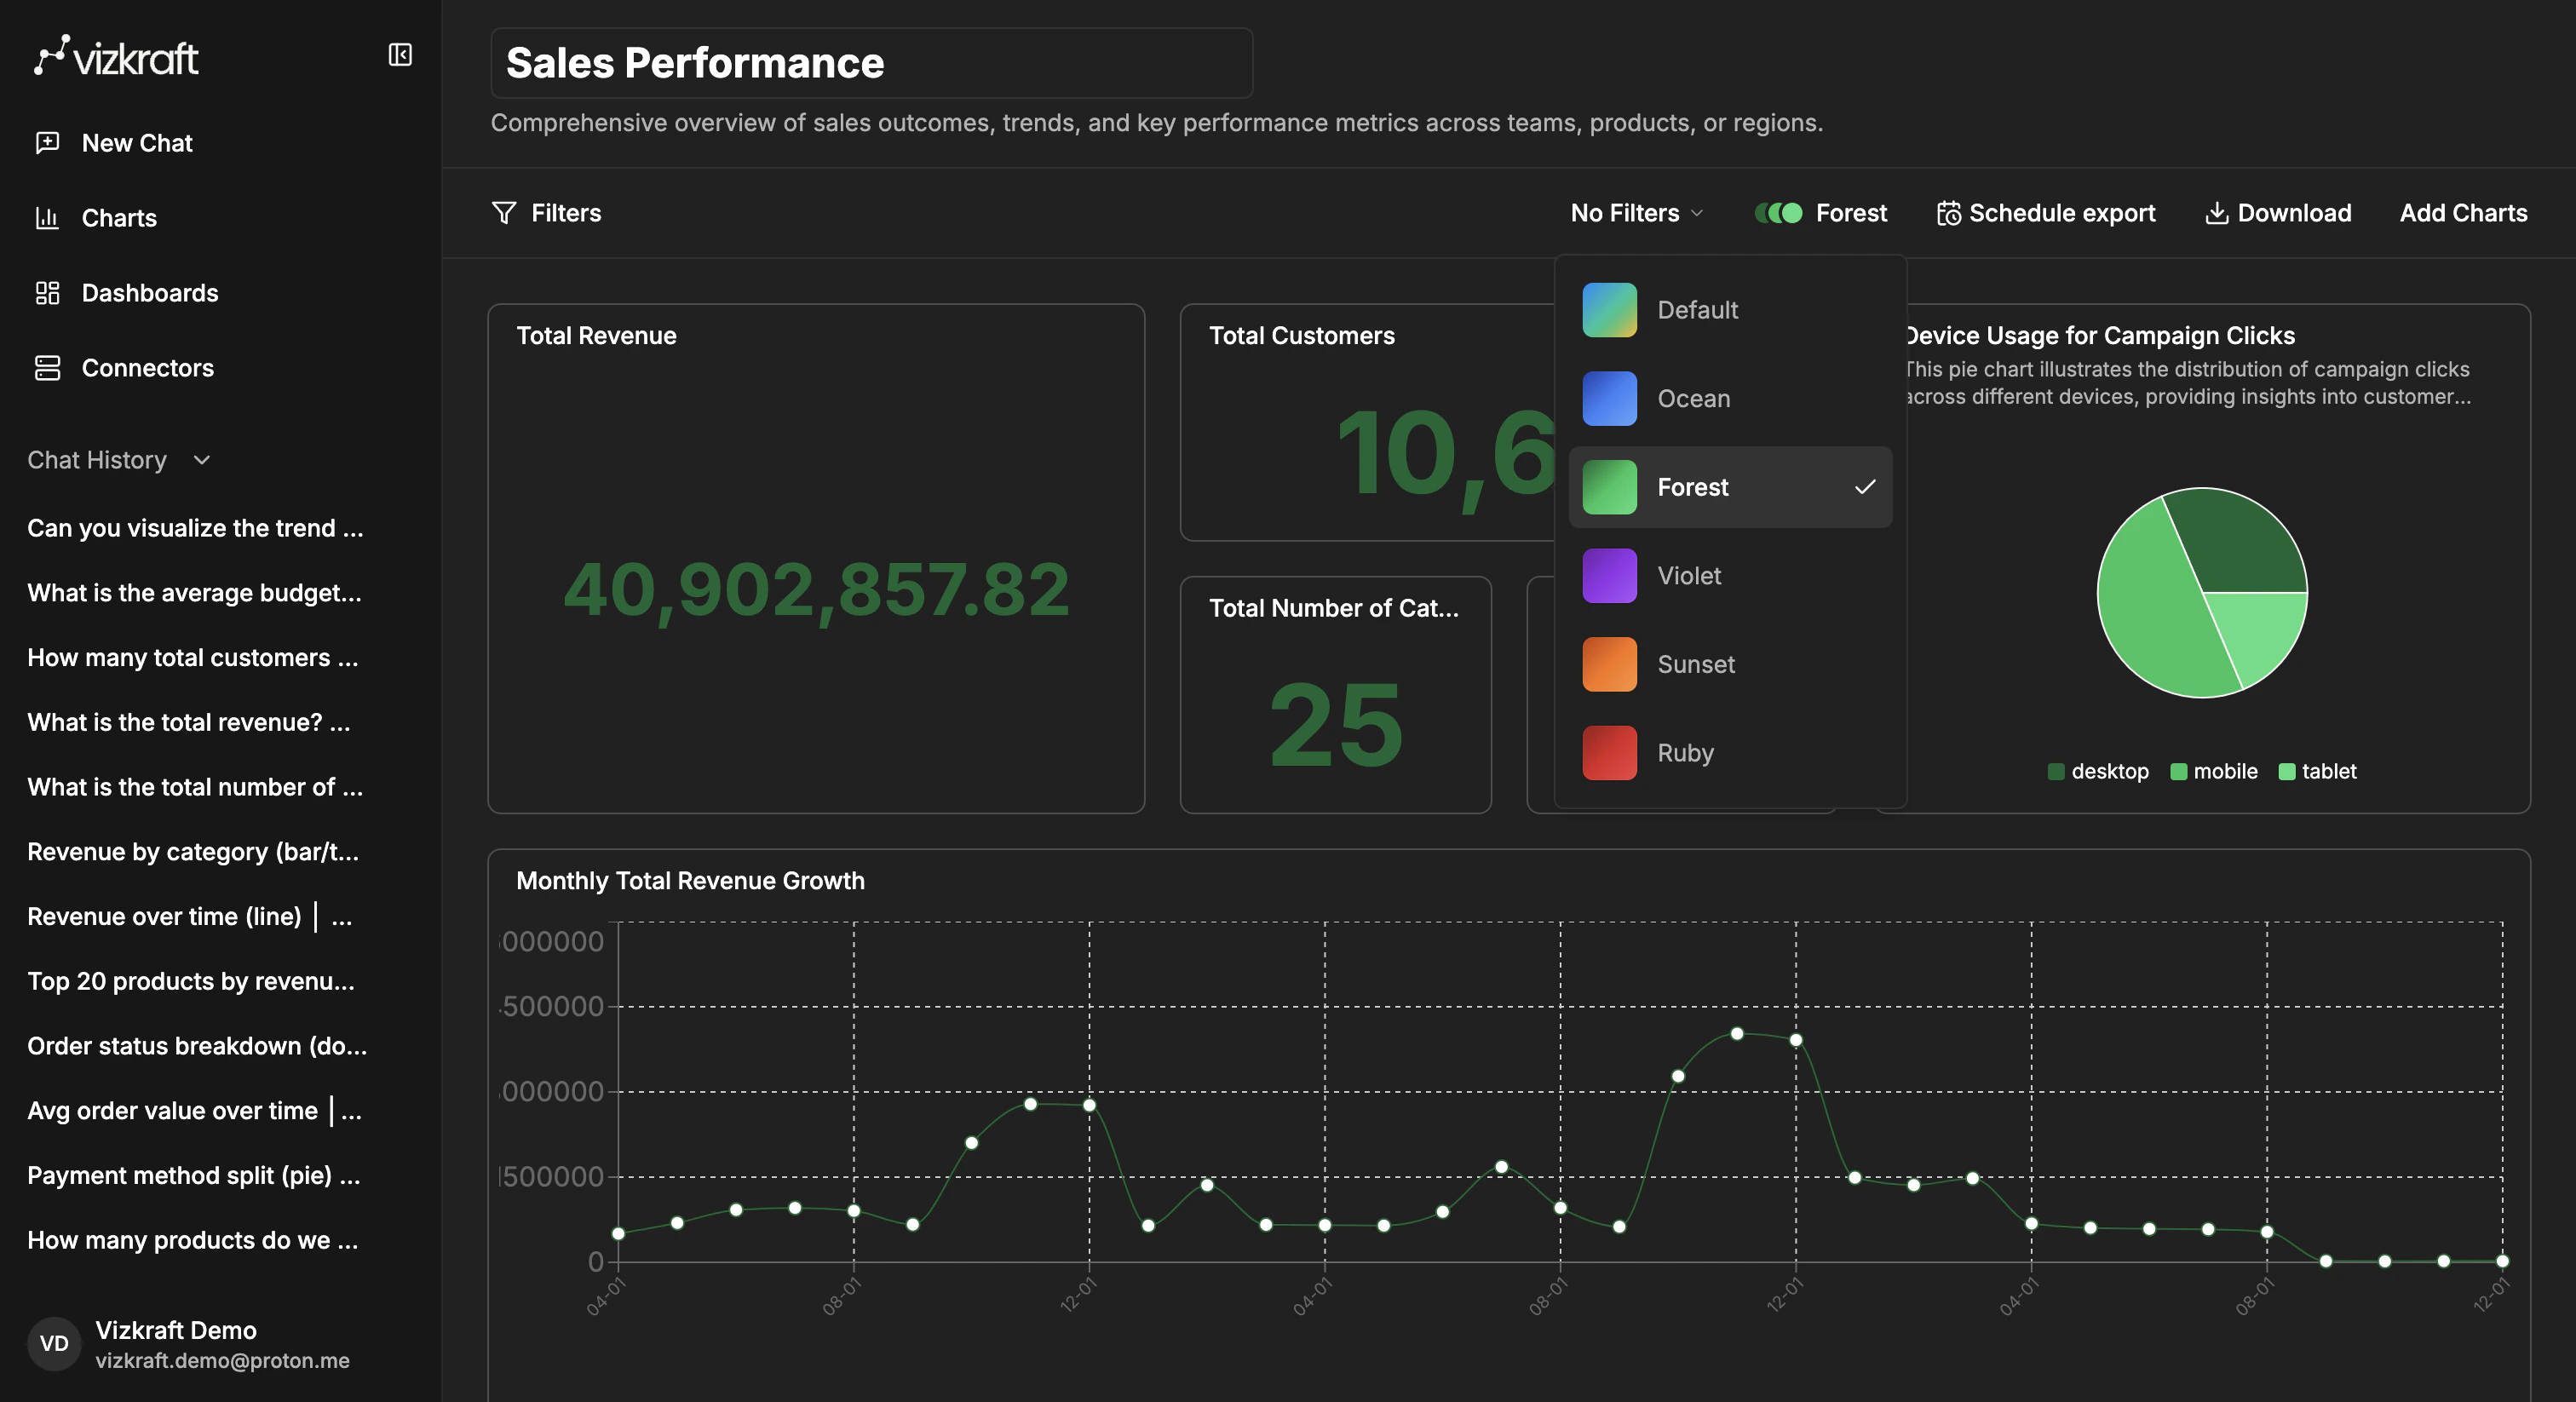
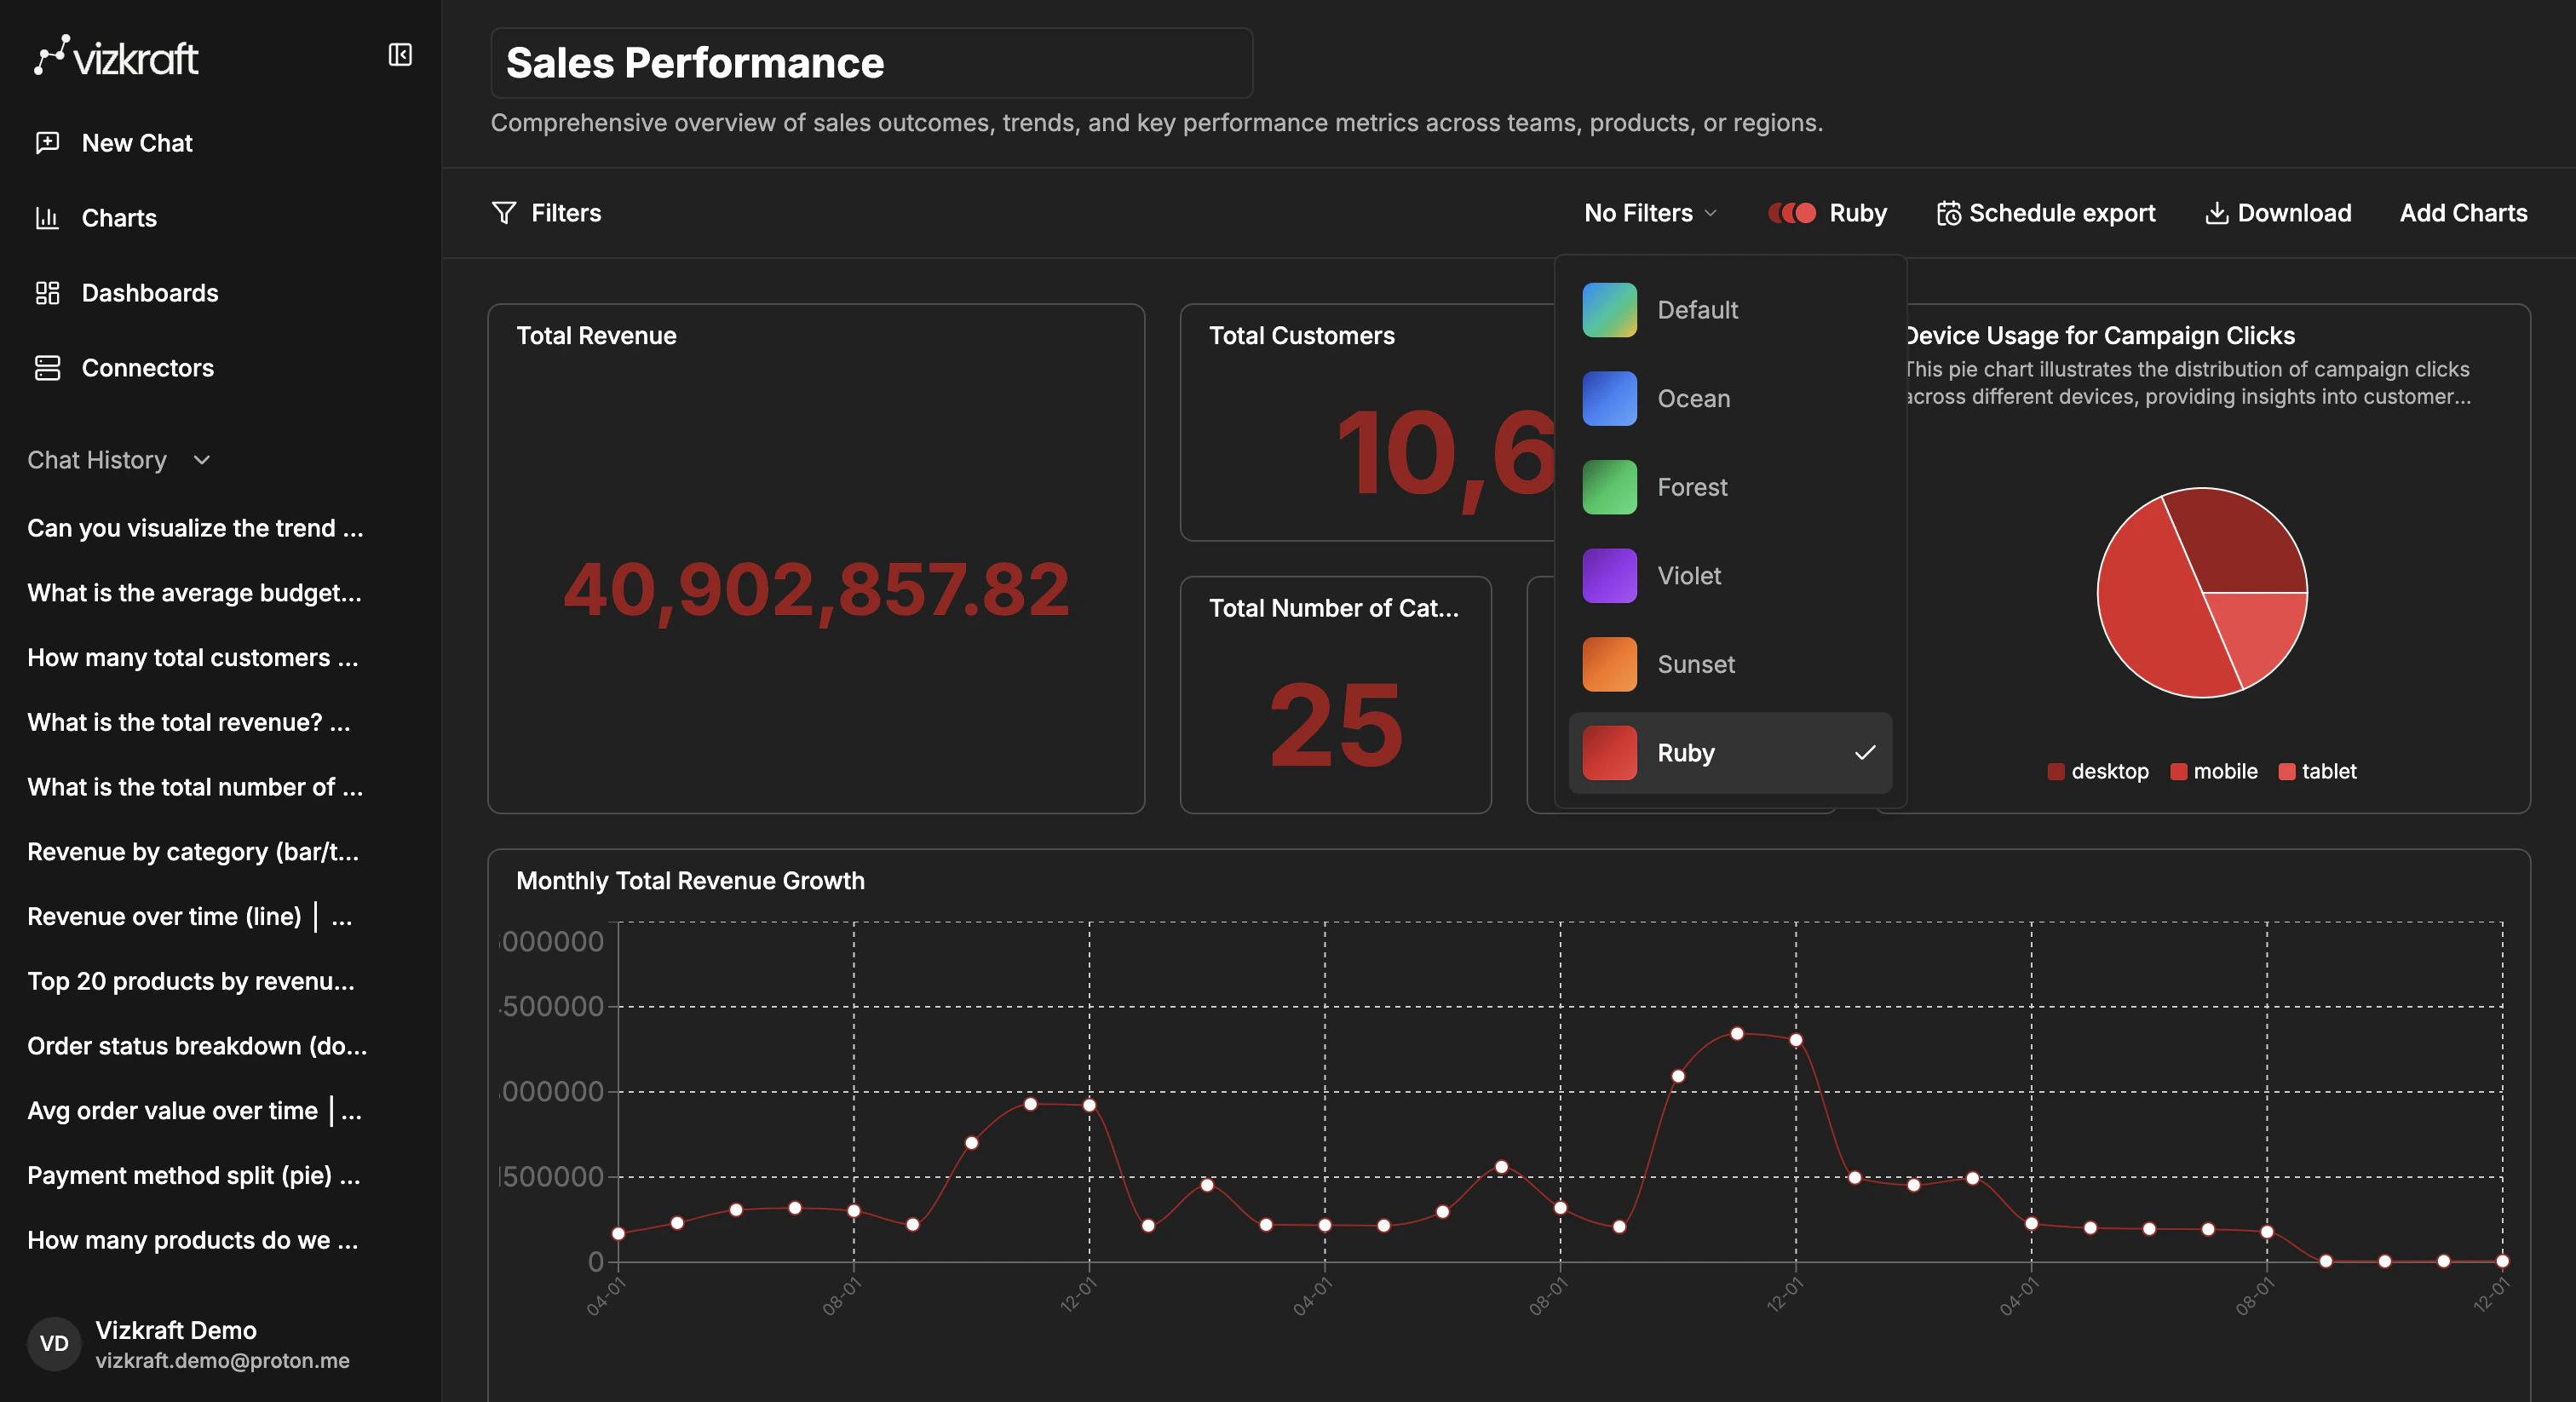
Dashboards support themes so a set of charts feels more consistent. Use the theme selector in the dashboard header, next to the export controls, to switch between available color themes such asDefault, Ocean, Forest, Violet, Sunset, and Ruby.
This is useful when:
- You want a color palette that better matches the story you are telling.
- A team prefers one visual style for recurring dashboard reviews.
- You want the dashboard to feel more polished before sharing or exporting it.