Ways charts are created
Depending on the result, Vizkraft can:- Generate a chart automatically with the answer.
- Offer suggested chart types for the same result.
- Create a chart from data that started as a table or text response.
Save a chart from chat
- Ask a question in
Chat. - Review the generated chart or chart suggestions.
- Save the chart you want to keep.
Charts page.
What you can do in the chart library
TheCharts page lets you:
- Browse saved charts.
- Search by title or description.
- Switch between card view and list view.
- Open a chart preview.
- Delete charts you no longer need.
- Review suggested charts separately from saved charts.
See the charts library
This view brings together suggested charts and the charts you have already saved, so it is easy to review new ideas and keep your library organized.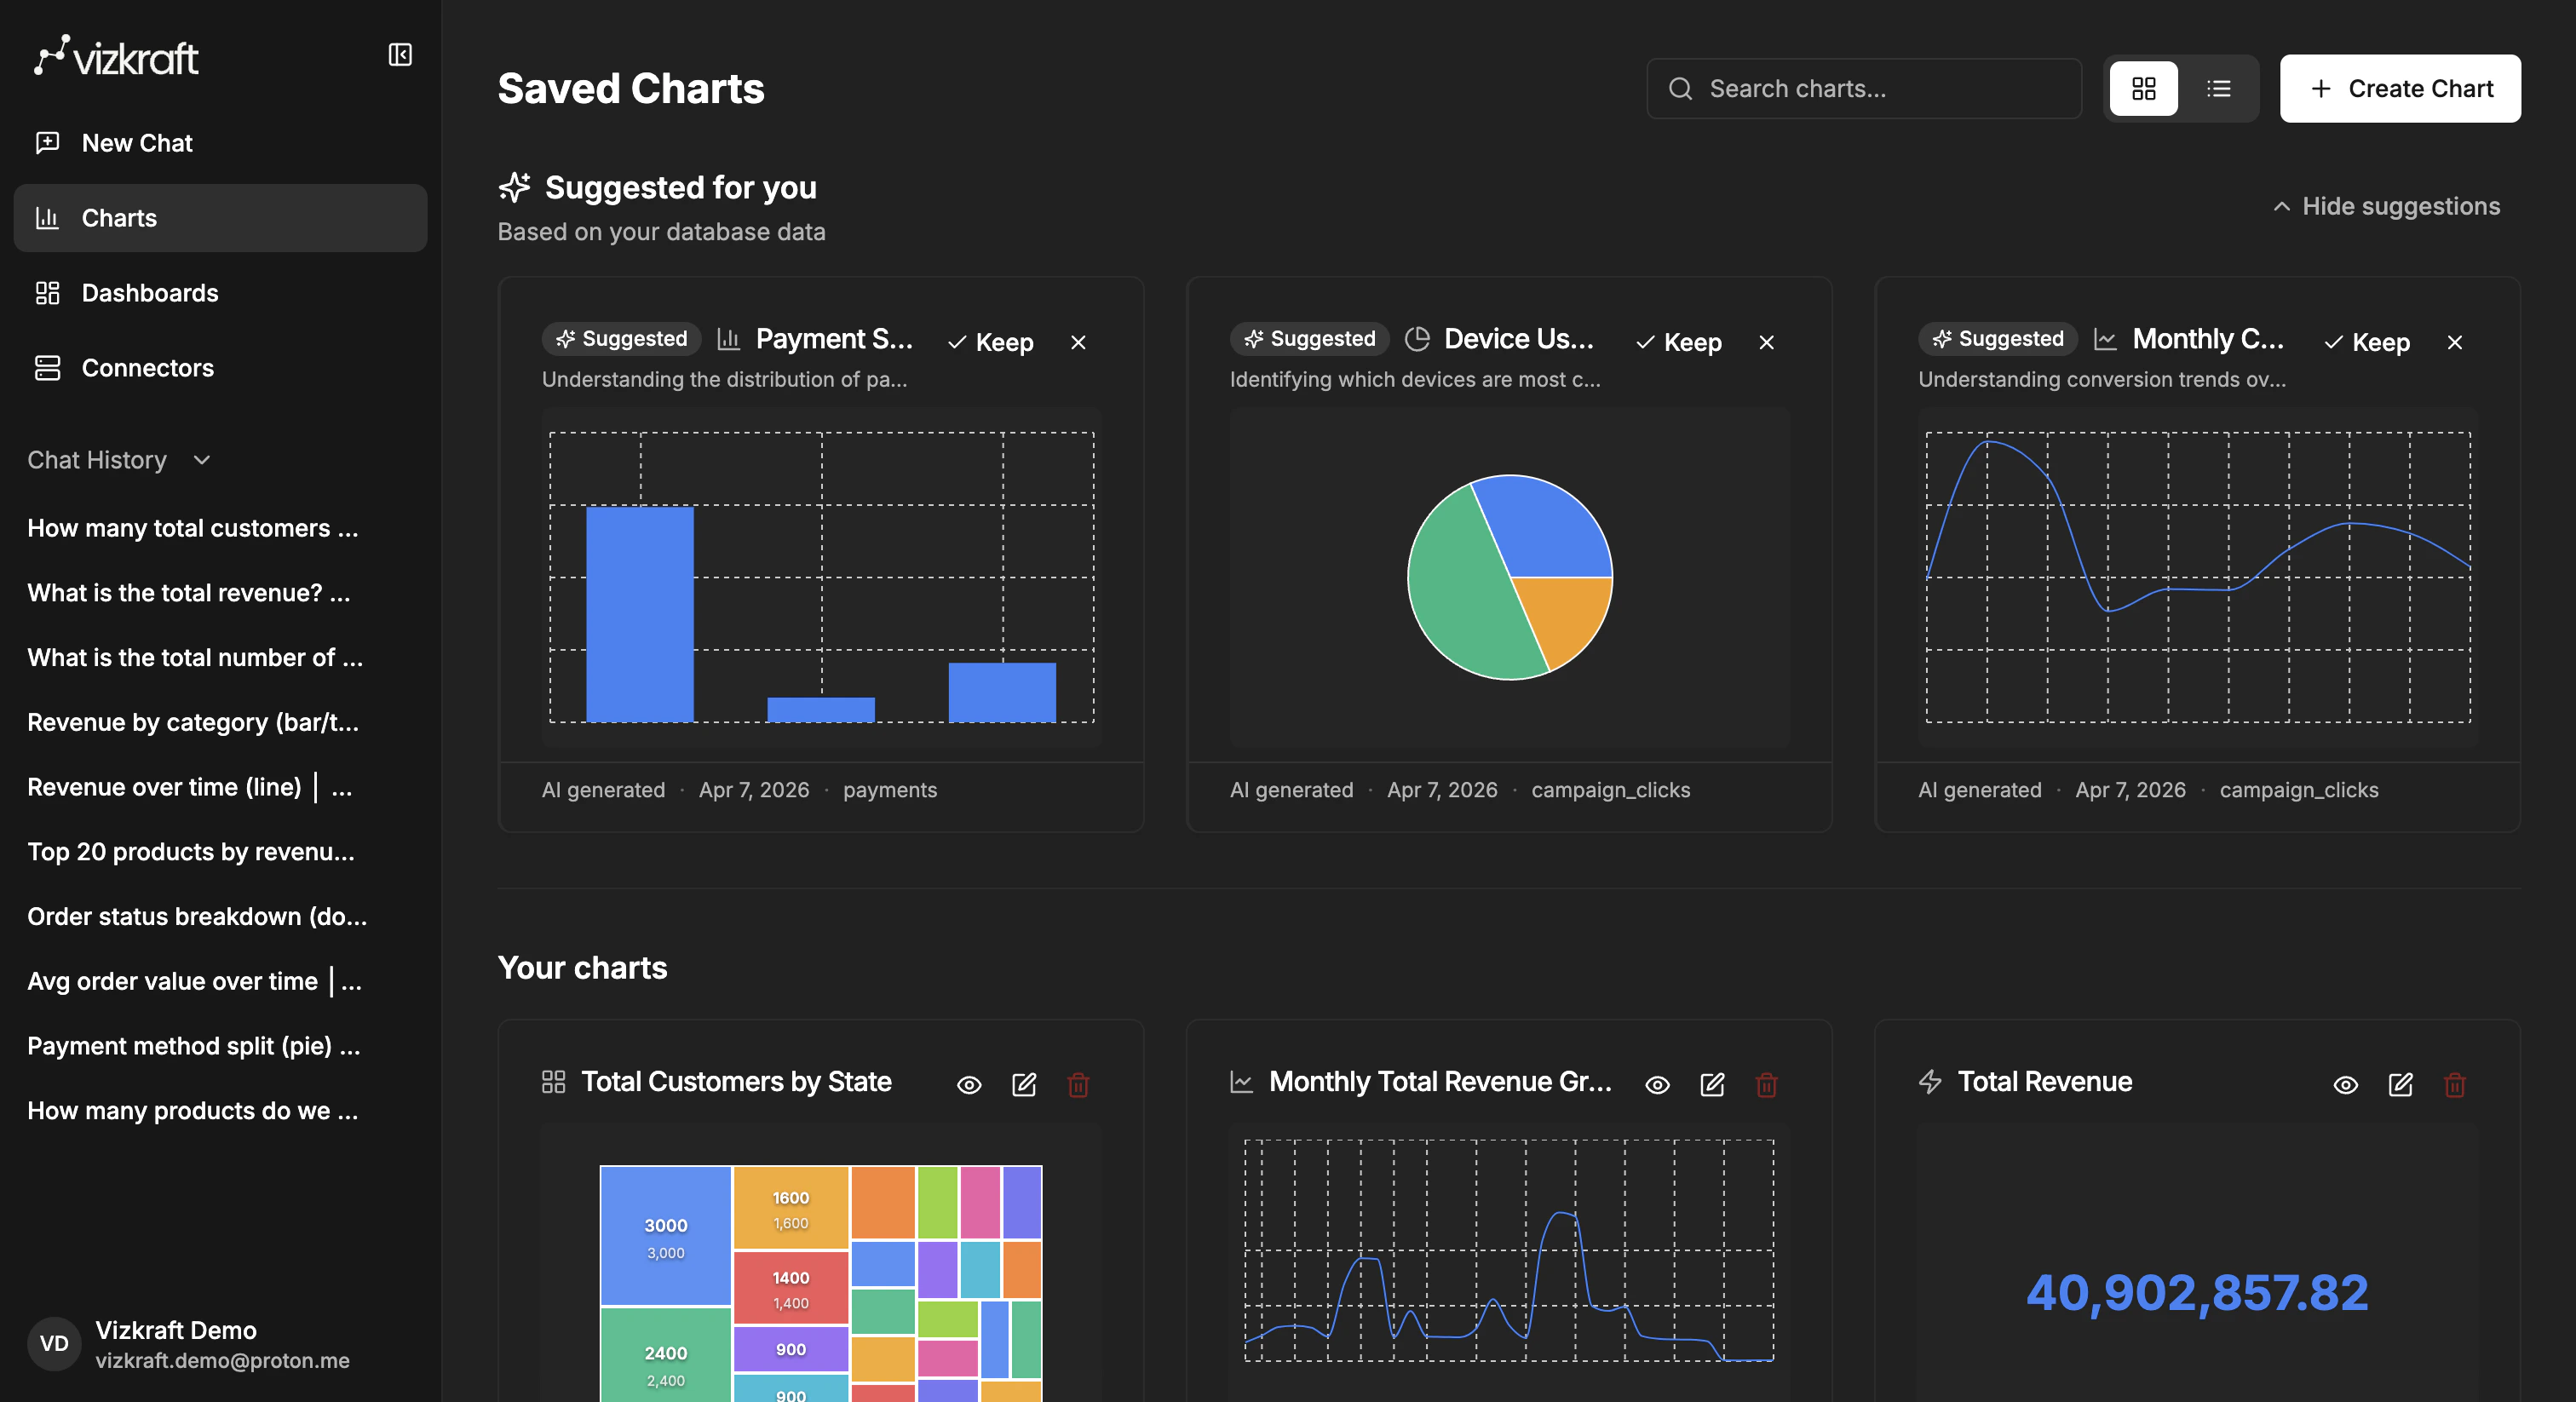
Suggested charts
When Vizkraft has enough context from an indexed connector, theCharts page can show a Suggested for you section.
From there you can:
- Keep a suggested chart and add it to your collection.
- Dismiss a suggestion you do not want.
When to save a chart
Save a chart when it is:- Useful for future analysis.
- Likely to be reused in a dashboard.
- A strong starting point for further editing.
- Worth sharing with teammates later.
Tips for better chart results
- Ask for a clear dimension and metric, such as revenue by month or tickets by priority.
- Add a time range when the trend matters.
- Use follow-up questions to reshape the result before saving.
- Keep only the strongest version of a chart so your library stays easy to manage.