Open the editor
You can reach the chart editor from:- The
Chartspage for a saved chart. - A chart created during chat before you add it to a dashboard.
What you can change
In the chart editor, you can update:- The chart title.
- The chart description.
- The chart type.
- Display settings such as axes, legend, grid, and data presentation.
- The chart configuration based on the data available in the result.
Edit with AI
The chart editor includes an Ask AI bar at the top of the screen. Describe the change you want in plain language instead of clicking through every setting.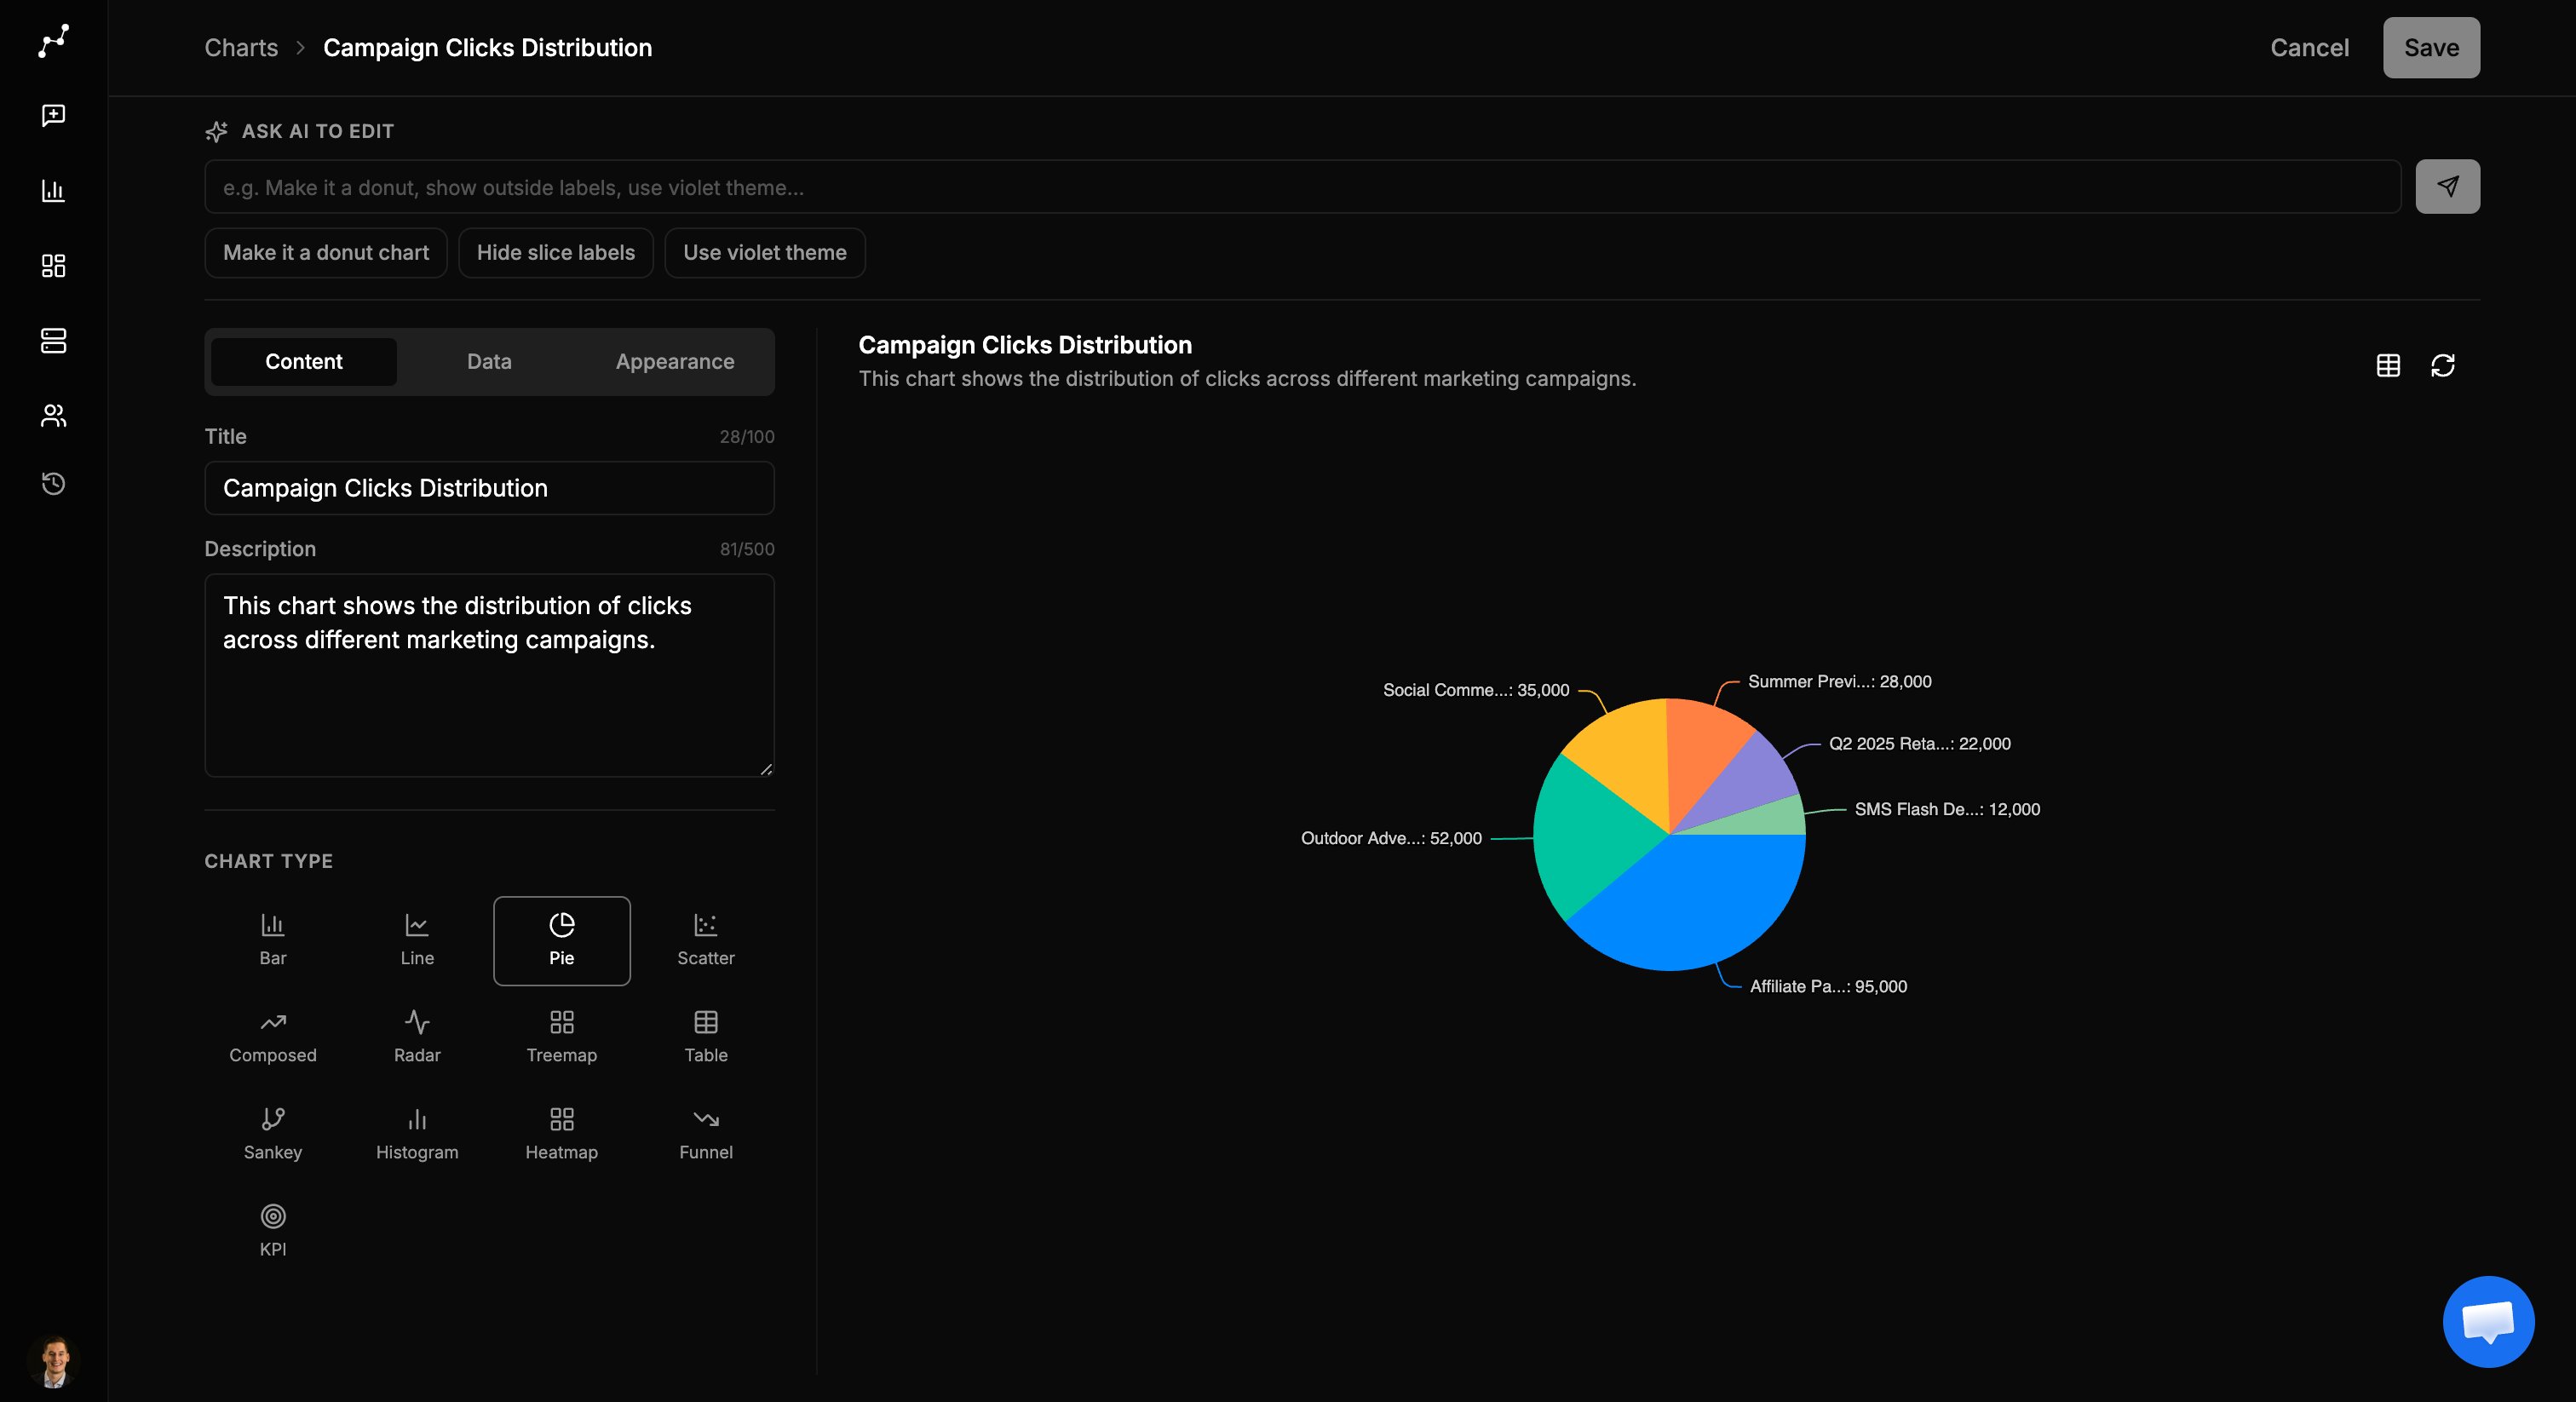
- Change this to a stacked bar chart.
- Sort bars from highest to lowest.
- Show only the top 10 categories.
- Use a shorter title that mentions quarterly revenue.
Refresh charts backed by live data
If a chart is tied to a live data source, Vizkraft can refresh the chart data instead of relying only on the original preview. This is useful when:- The underlying data changes often.
- You want the dashboard version of the chart to stay current.
- You are checking whether a saved chart still reflects the latest numbers.
Save carefully
Before saving:- Confirm the title still matches the metric and breakdown.
- Make sure the chart type supports the story you want to tell.
- Check that the description adds useful context for future viewers.
After editing
Once saved, the updated chart can be:- Reused in the chart library.
- Added to a dashboard.
- Opened again later for additional changes.